103
Statistical Graphs and Calculations Chapter 7
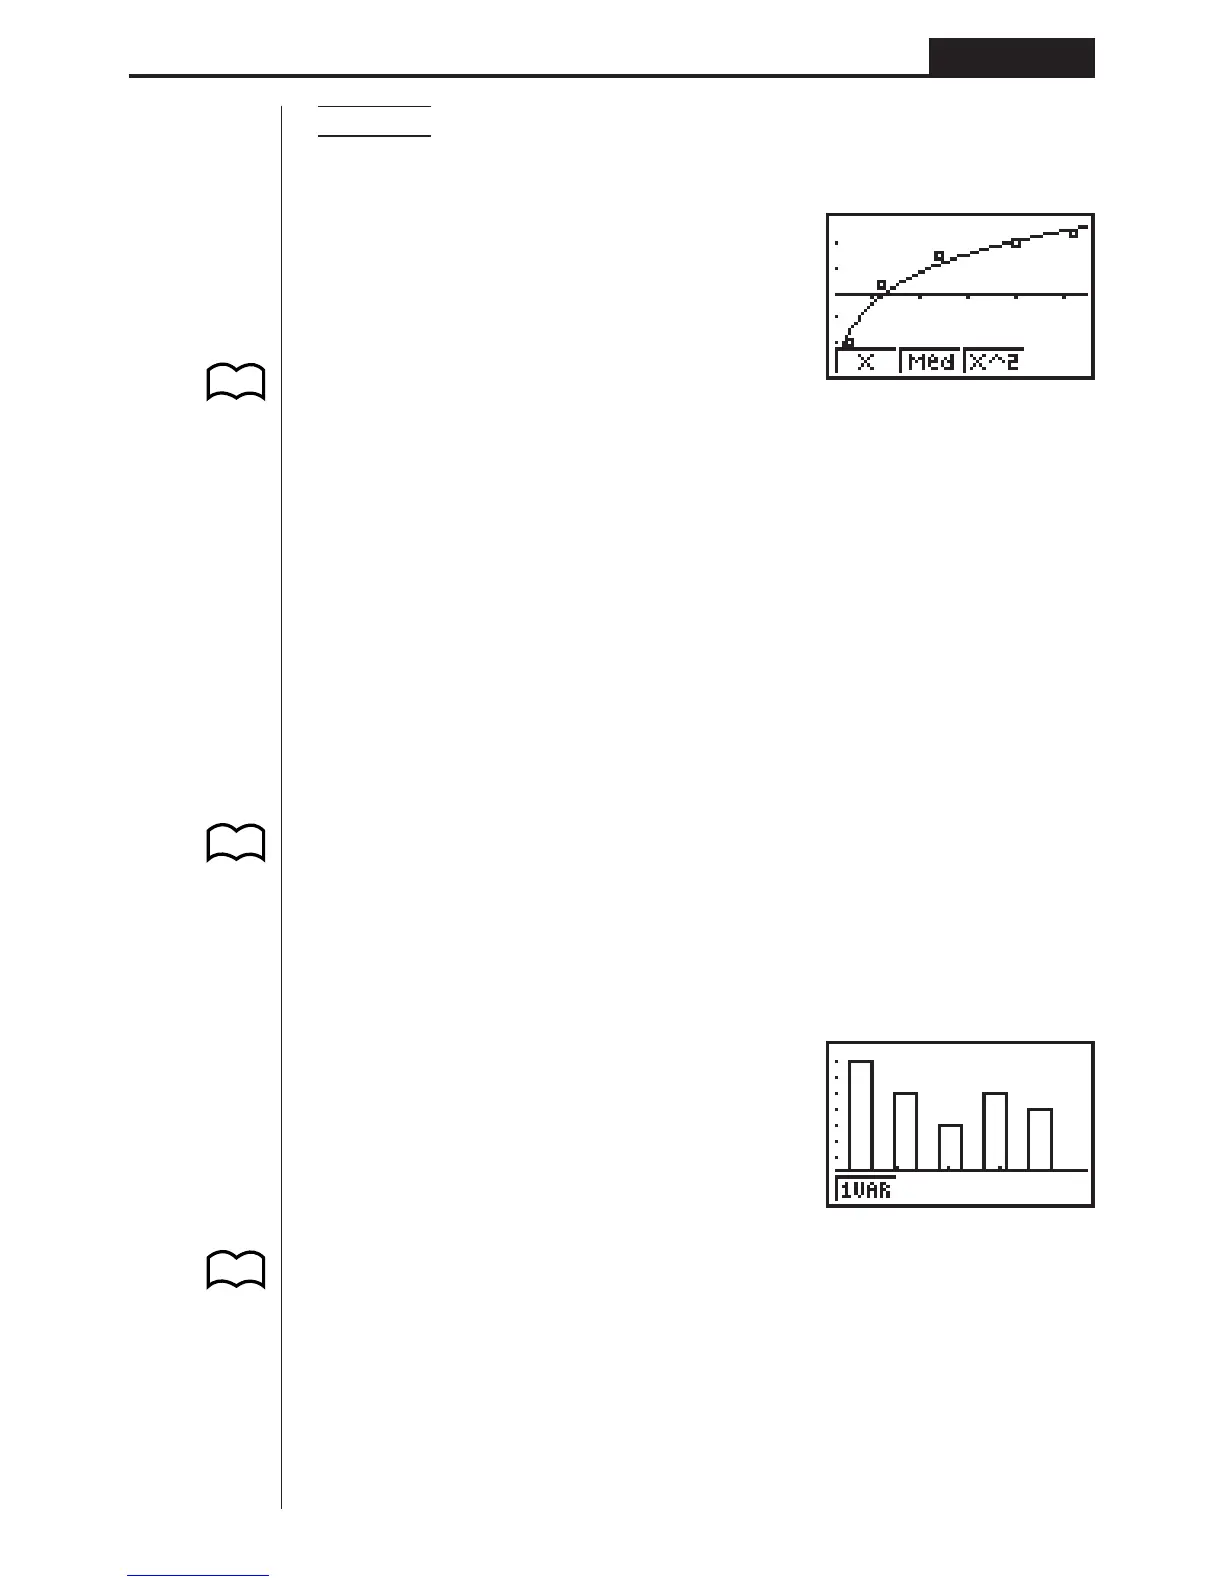
Example To graph a logarithmic regression
While logarithmic regression parameter calculation results are on the display, press
4 (DRAW).
4(DRAW)
For details on the meanings of function menu items at the bottom of the display, see
“Selecting the Regression Type”.
3. Calculating and Graphing Single-
Variable Statistical Data
Single-variable data is data with only a single variable. If you are calculating the
average height of the members of a class for example, there is only one variable
(height).
Single-variable statistics include distribution and sum. The following three types of
graphs are available for single-variable statistics.
kk
kk
k Drawing a Histogram (Bar Graph)
From the statistical data list, press 1 (GRPH) to display the graph menu, press
[4 (SET), and then change the graph type of the graph you want to use (GPH1,
GPH2, GPH3) to histogram (bar graph).
Data should already be input in the statistical data list (see “Inputting Data into Lists”).
Draw the graph using the procedure described under “Plotting Data”.
kk
kk
k Box Graph
This type of graph lets you see how a large number of data items are grouped within
specific ranges. A box encloses all the data in an area from the 25th percentile to the
75th percentile, with a line drawn at the 50th percentile. Lines (called whiskers) ex-
tend from either end of the box up to the minimum and maximum of the data.
From the statistical data list, press 1 (GRPH) to display the graph menu, press
[4 (SET), and then change the graph type of the graph you want to use (GPH1,
GPH2, GPH3) to box graph.
P.101
P.99
(G-Type)
(Hist)
P.95
P.99
(G-Type)
(Box)
 Loading...