104
Statistical Graphs and Calculations Chapter 7
kk
kk
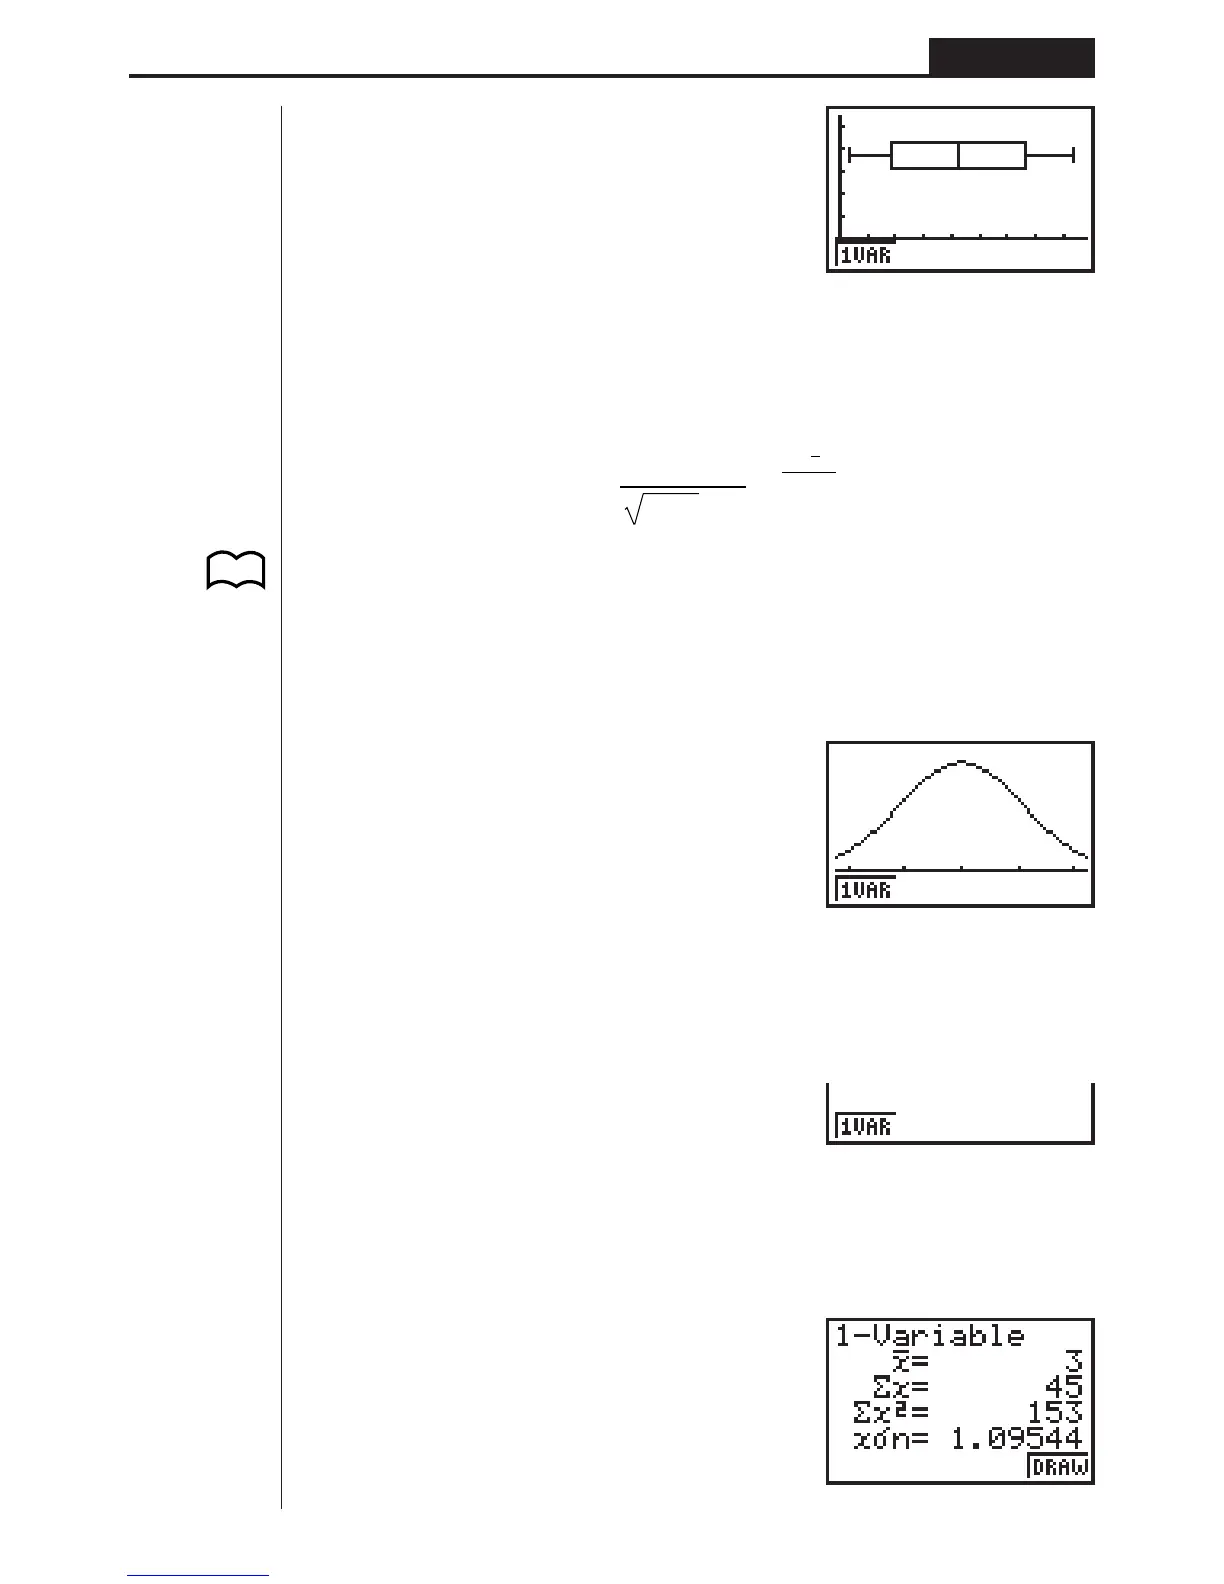
k Normal Distribution Curve
The normal distribution curve is graphed using the following normal distribution func-
tion.
The distribution of characteristics of items manufactured according to some fixed
standard (such as component length) fall within normal distribution. The more data
items there are, the closer the distribution is to normal distribution.
From the statistical data list, press 1 (GRPH) to display the graph menu, press
[4 (SET), and then change the graph type of the graph you want to use (GPH1,
GPH2, GPH3) to normal distribution.
kk
kk
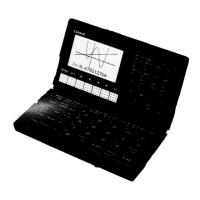
k Displaying Single-Variable Statistical Results
Single-variable statistics can be expressed as both graphs and parameter values.
When these graphs are displayed, the menu at the bottom of the screen appears as
below.
1 (1VAR) ..... Single-variable calculation result menu
Pressing 1 (1VAR) displays the following screen.
1(1VAR)
1 234
P.99
(G-Type)
(N•Dis)
 Loading...