105
Statistical Graphs and Calculations Chapter 7
The following describes the meaning of each of the parameters.
_
x ..................... Mean of data
#x ................... Sum of data
#x
2
.................. Sum of squares
x"n .................. Population standard deviation
x"n-1 ................ Sample standard deviation
n ..................... Number of data items
minX ............... Minimum
Q1 .................. First quartile
Med ................ Median
Q3 .................. Third quartile
maxX .............. Maximum
Mod ................ Mode
• Press 4 (DRAW) to return to the original single-variable statistical graph.
4. Calculating and Graphing Paired-
Variable Statistical Data
Under “Plotting a Scatter Diagram,” we displayed a scatter diagram and then per-
formed a logarithmic regression calculation. Let’s use the same procedure to look at
the six regression functions.
kk
kk
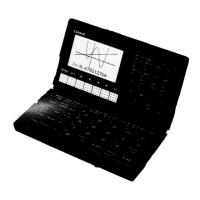
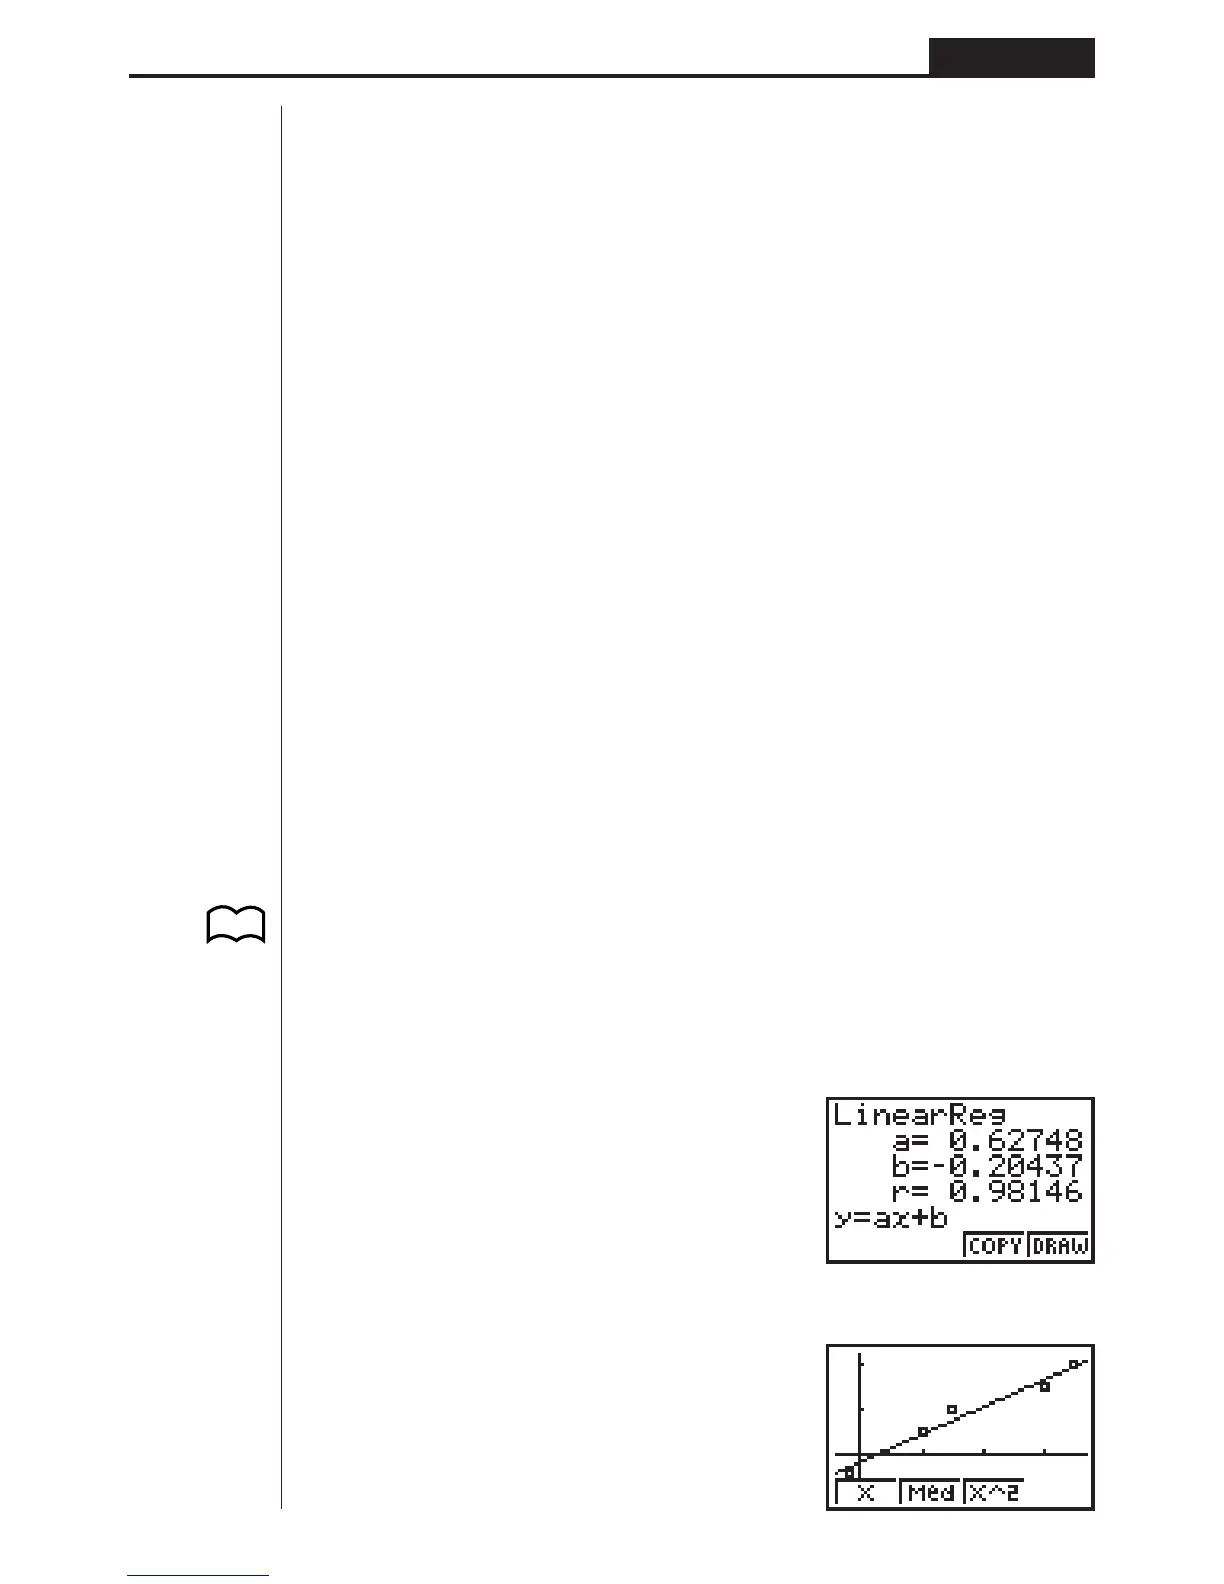
k Linear Regression Graph
Linear regression plots a straight line that passes close to as many data points as
possible, and returns values for the slope and y -intercept (y-coordinate when x = 0)
of the line.
The graphic representation of this relationship is a linear regression graph.
Q1(GRPH)[4(SET)c
1(Scat)
Q1(GRPH)1(GPH1)
1(X)
4(DRAW)
1234
P.98
(G-Type)
(Scat)
(GPH1)
(X)