115
Statistical Graphs and Calculations Chapter 7
kk
kk
k Estimated Value Calculation ( , )
After drawing a regression graph with the STAT Mode, you can use the RUN Mode
to calculate estimated values for the regression graph's x and y parameters.
• Note that you cannot obtain estimated values for Med-Med graph and quad-
ratic regression graph.
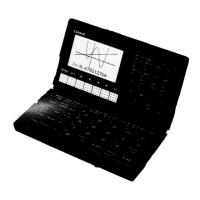
Example To perform power regression using the following data and
estimate the values of and when xi = 40 and yi = 1000
xi (List 1) yi (List 2)
28 2410
30 3033
33 3895
35 4491
38 5717
1. In the Main Menu, select the STAT icon and enter the STAT Mode.
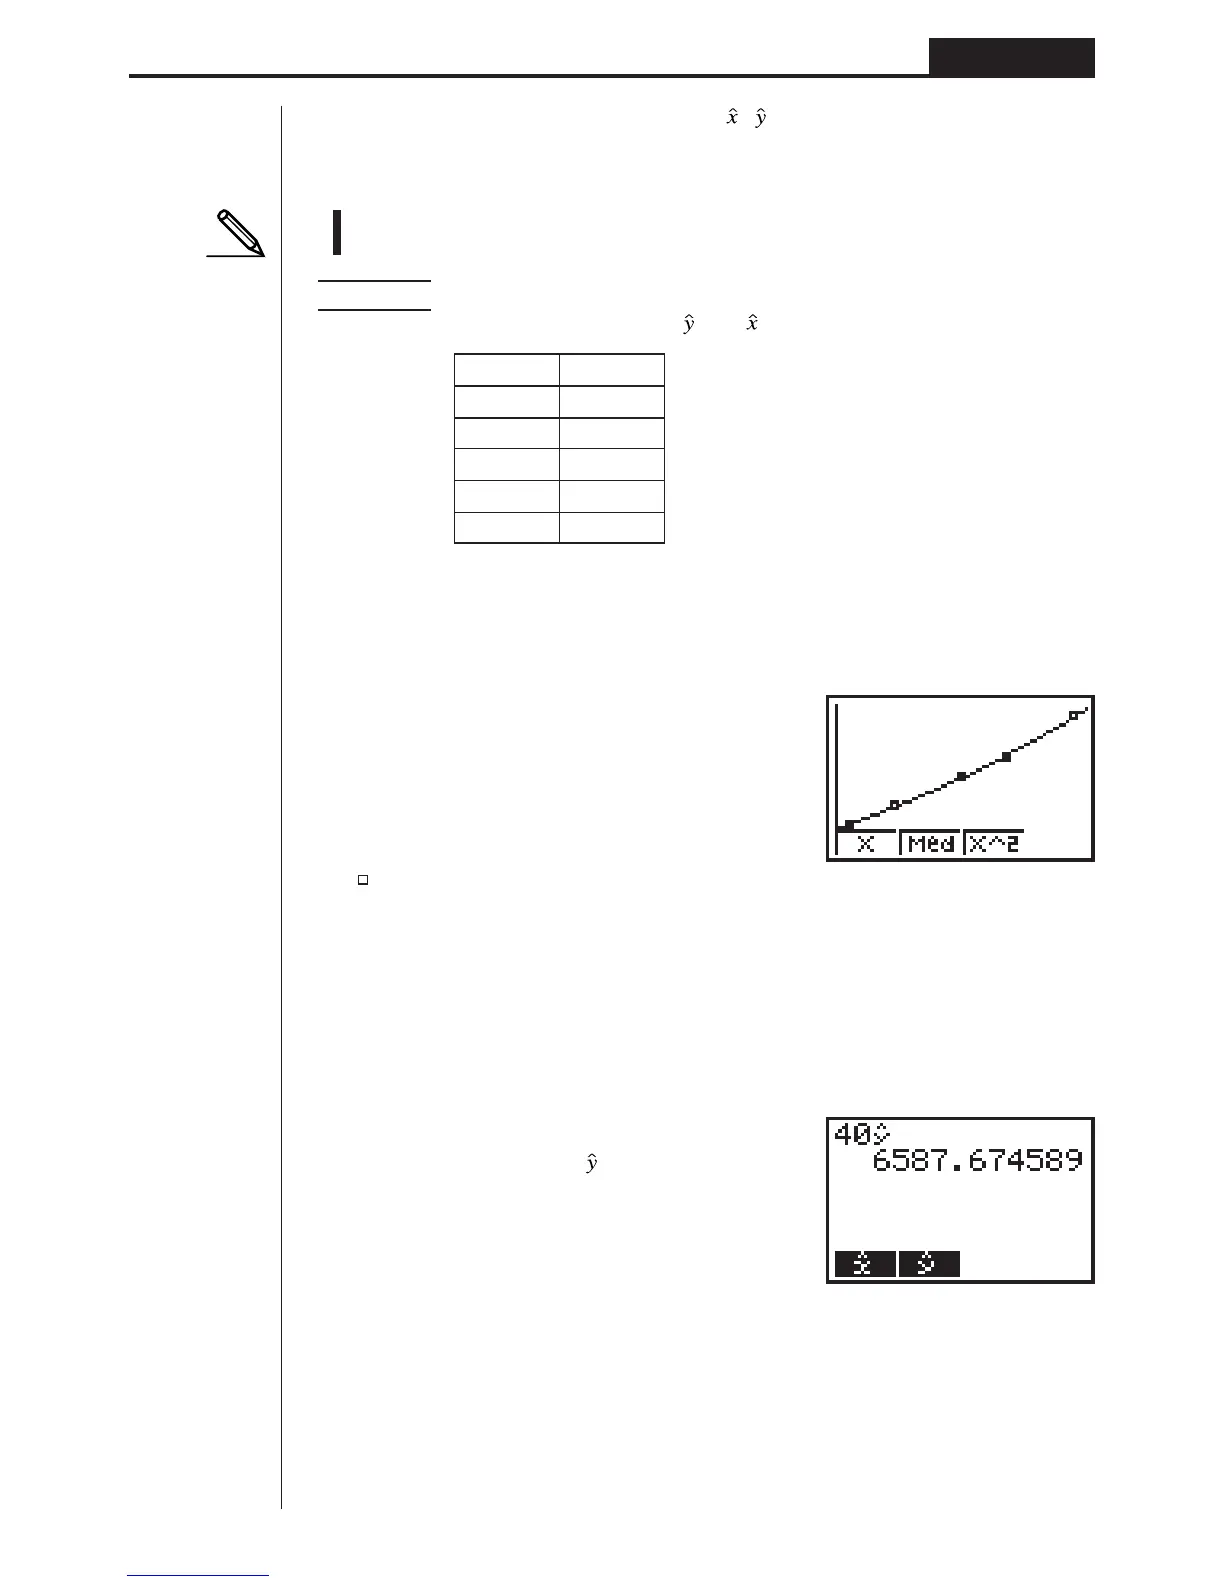
2. Input data into the list and draw the power regression graph.
1(GRPH)[4(SET)c
1(Scat)c
1(List1)c
2(List2)c
1(1)c
1(
)Q
!Z1(Auto)Q1(GRPH)1(GPH1)[
3(Pwr)4(DRAW)
3. In the Main Menu, select the RUN icon and enter the RUN Mode.
4. Press the keys as follows.
ea(value of
xi)
K3(STAT)2( )w
(G-Type)
(Scat)
(XList)
(YList)
(Freq)
(M-Type)
(Auto)
(Pwr)
1234
 Loading...