149
Programming Chapter 8
The graph conditions that are required depends on the graph type. See “Changing
Graph Parameters”.
• The following is a typical graph condition specification for a scatter diagram or
xy line graph.
S-Gph1 DrawOn, Scatter, List1, List2, 1, Square_
In the case of an
xy line graph, replace “Scatter” in the above specification with
“xyLine”.
• The following is a typical graph condition specification for a single-variable graph.
S-Gph1 DrawOn, Hist, List1, List2_
The same format can be used for the following types of graphs, by simply replac-
ing “Hist” in the above specification with the applicable graph type.
Histogram: ...................... Hist
Median Box: ................... MedBox
Normal Distribution: ........ N-Dist
• The following is a typical graph condition specification for a regression graph.
S-Gph1 DrawOn, Linear, List1, List2, List3_
The same format can be used for the following types of graphs, by simply replac-
ing “Linear” in the above specification with the applicable graph type.
Linear Regression: ......... Linear
Med-Med: ....................... Med-Med
Quadratic Regression:.... Quad
Logarithmic Regression: .. Log
Exponential Regression: Exp
Power Regression : ........Power
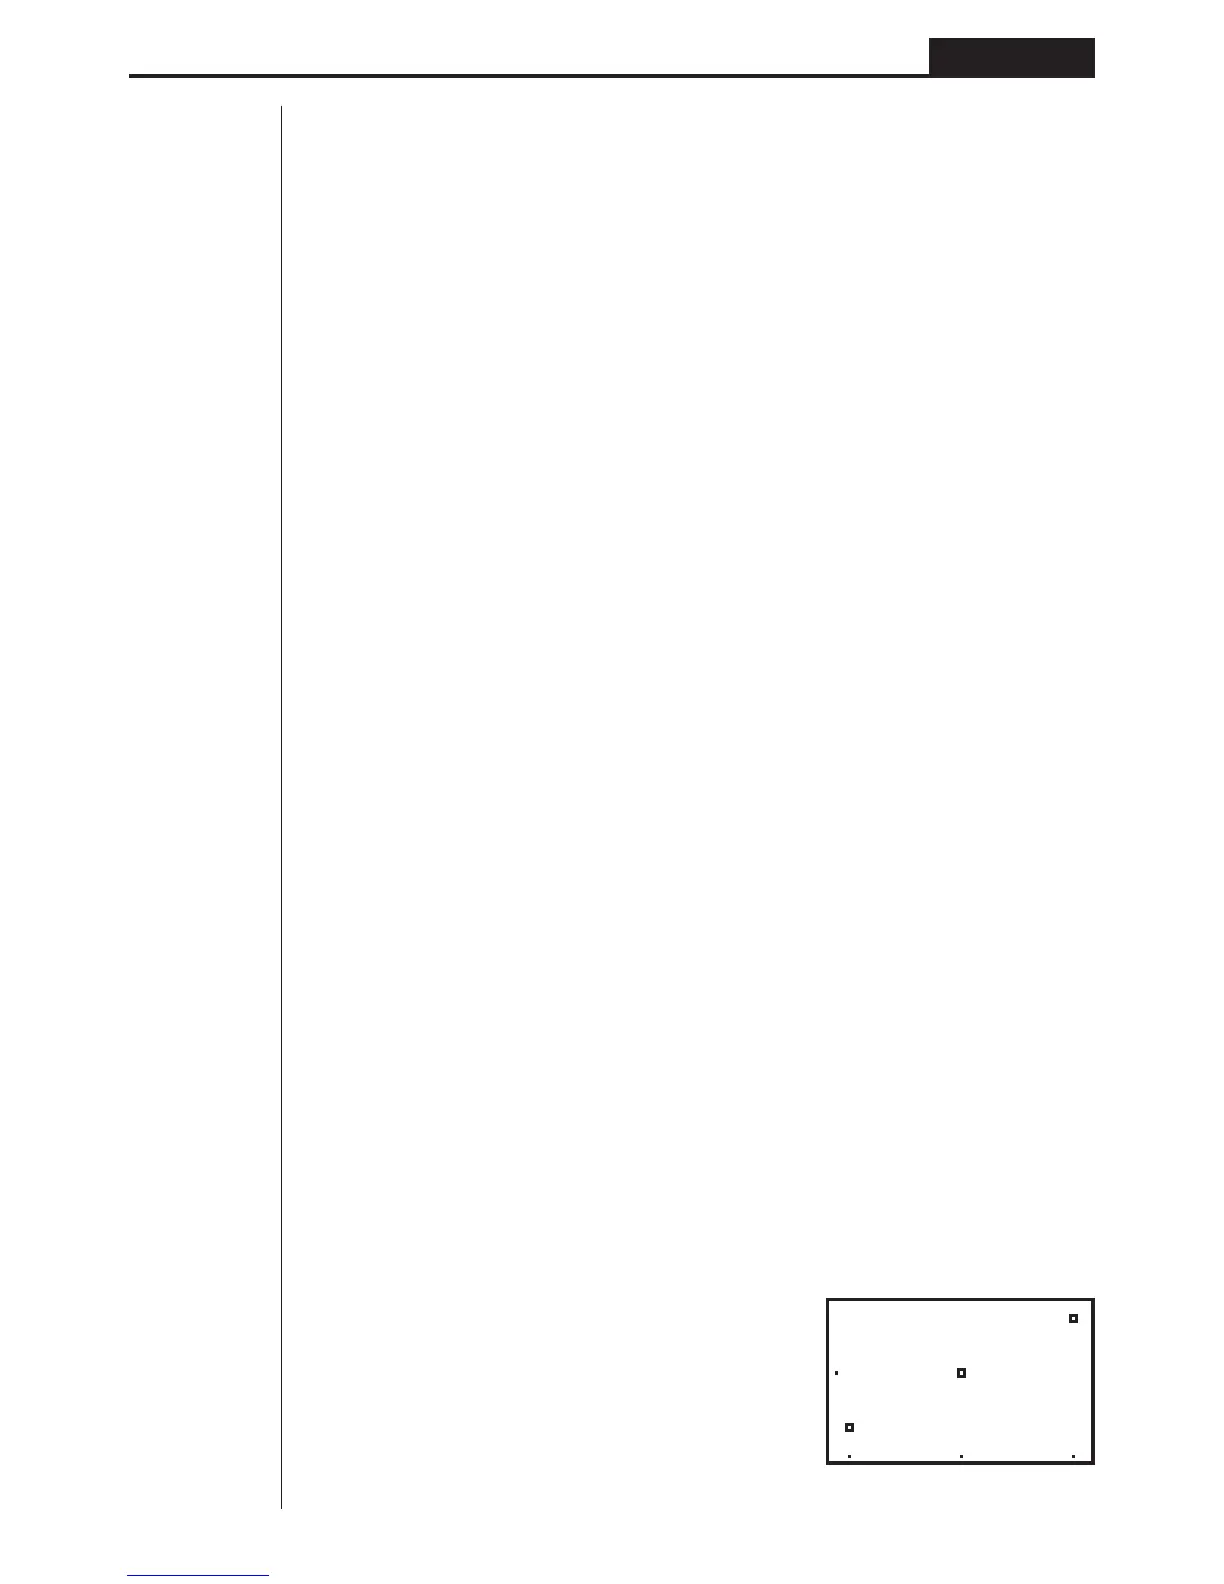
Example Program
ClrGraph_
1
!Z[[[1Q
1
S-WindAuto_
2
K11
{1, 2, 3} "
2
List 1_
3
1Q
{1, 2, 3} "
3
List 2_
4
3121Q
4
S-Gph1
5
DrawOn,
5
3111Q
6
Scatter, List1, List2, 1,
7
Square_
6
312[1Q
8
DrawStat
7
3141Q
8
!W[41Q
Executing this program produces the scatter diagram shown here.