56
Graphing Chapter 4
[
1 (Y >) ......... Y > f
(x) inequality
2 (Y <) ......... Y < f
(x) inequality
3 (Y #) ......... Y >
f
(x) inequality
4 (Y $) ......... Y < f
(x) inequality
Press [ to return to the previous menu.
uu
uu
uTo graph using rectangular coordinates (Y =)
You can graph functions that can be expressed in the format y = f(x).
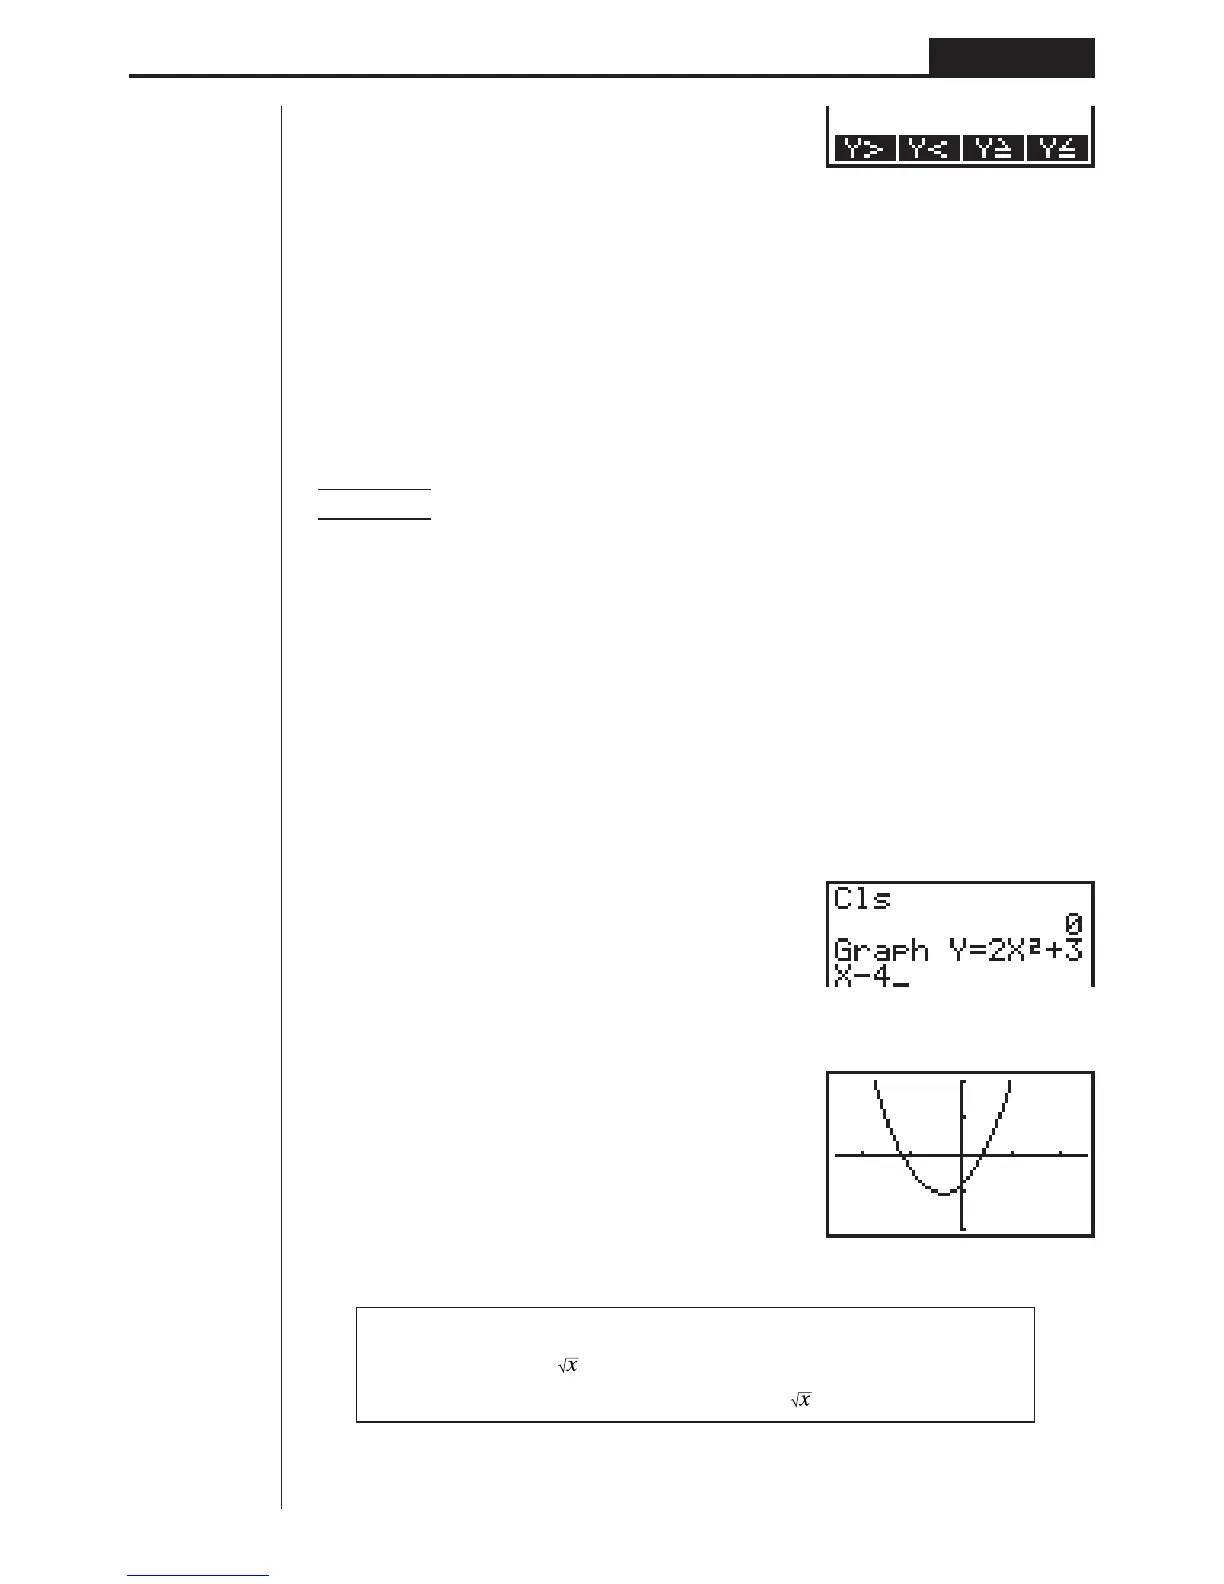
Example To graph y = 2x
2
+ 3x – 4
Use the following View Window parameters.
Xmin = –5 Ymin = –10
Xmax = 5 Ymax = 10
Xscl = 2 Yscl = 5
1. In the set-up screen, specify the appropriate graph type for F-Type.
!Z1(Y =)Q
2. Input the rectangular coordinate (Y =) expression.
A!4(SKTCH)1(Cls)w
2(GRPH)1(Y =)
cTx+dT-e
3. Press w to draw the graph.
w
• You can draw graphs of the following built-in scientific functions.
• sin x • cos x • tan x • sin
–1
x • cos
–1
x
• tan
–1
x • • x
2
• log x • lnx
• 10
x
• e
x
• x
–1
•
3
View Window settings are made automatically for built-in graphs.
1 2 3 4 [