64
Graphing Chapter 4
Use the following View Window parameters.
Xmin = –8 Ymin = –30
Xmax = 8 Ymax = 30
Xscl = 5 Yscl = 10
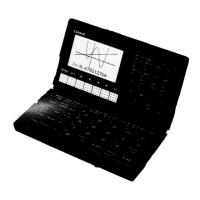
1. After graphing the functions, press !2 (ZOOM), and the pointer appears on
the screen.
!2(ZOOM)
2. Use the cursor keys (d, e, f, c) to move the pointer to the location that
you want to be the center of the new display.
d
~ d f ~ f
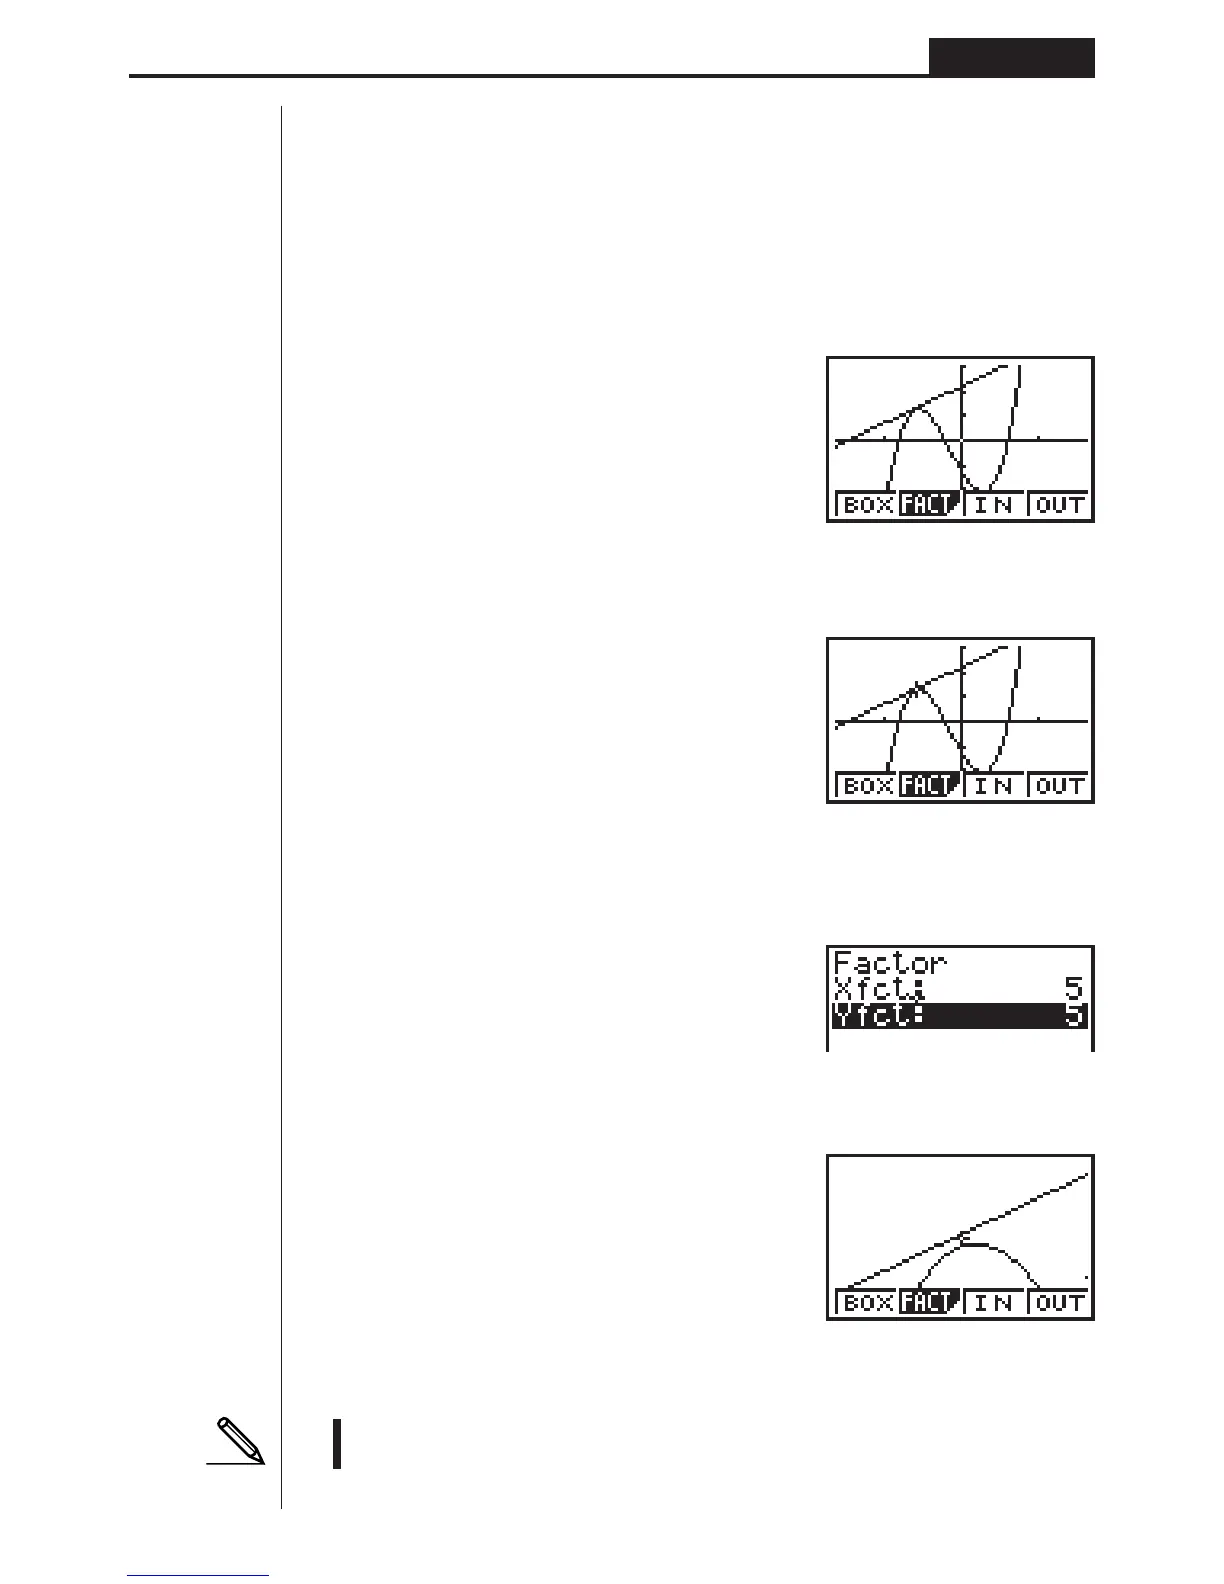
3. Press 2 (FACT) to display the factor specification screen, and input the factor
for the x- and y-axes.
2(FACT)
fwfw
4. Press Q to return to the graphs, and then press 3 (IN) to enlarge them.
Q3(IN)
This enlarged screen makes it clear that the graphs of the two expressions are not
tangential.
• Note that the above procedure can also be used to reduce the size of a graph
(zoom out). In step 4, press 4 (OUT).
1 2 34