66
Graphing Chapter 4
[
• Other menu items are identical to those in the STAT, GRAPH, TABLE Mode menu.
The Sketch function lets you draw lines and plot points on a graph that is already on
the screen.
All the examples in this section that show operations in the STAT, GRAPH or TABLE
Mode are based on the assumption that the following function has already been
graphed in the GRAPH Mode.
Memory Area Y1:
y = x(x + 2)(x – 2)
The following are the View Window parameters used when drawing the graph.
Xmin = –5 Ymin = –5
Xmax = 5 Ymax = 5
Xscl = 1 Yscl = 1
uu
uu
uTo plot points
In the STAT, GRAPH or TABLE Mode
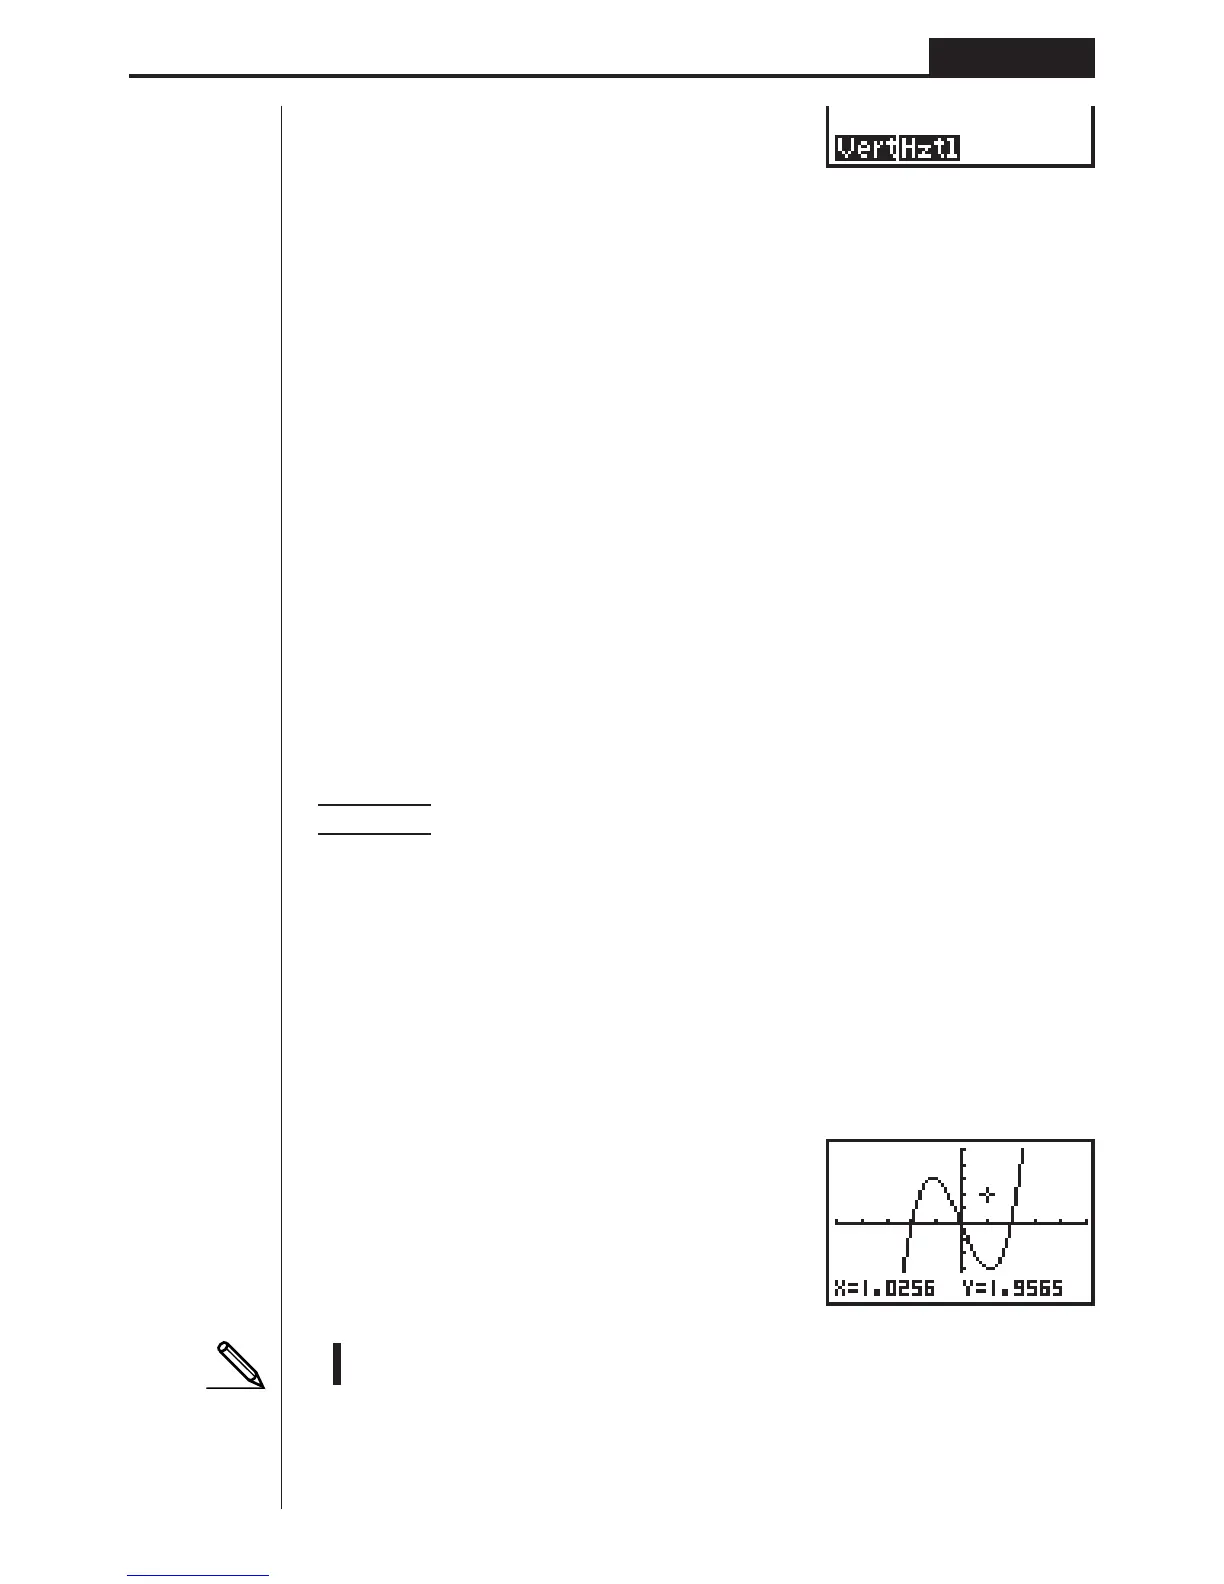
Example To plot a point on the graph of y = x(x + 2)(x – 2)
1. After graphing the function, display the sketch menu and perform the following
operation to cause the pointer to appear on the graph screen.
!4(SKTCH)3(Plot)
2. Use the cursor keys (f, c, d, e) to move the pointer the locations of the
points you want to plot and press w to plot.
• You can plot as many points as you want.
e ~ ef ~ f
w
• The current x- and y-coordinate values are assigned respectively to variables X
and Y.
1234
 Loading...