142
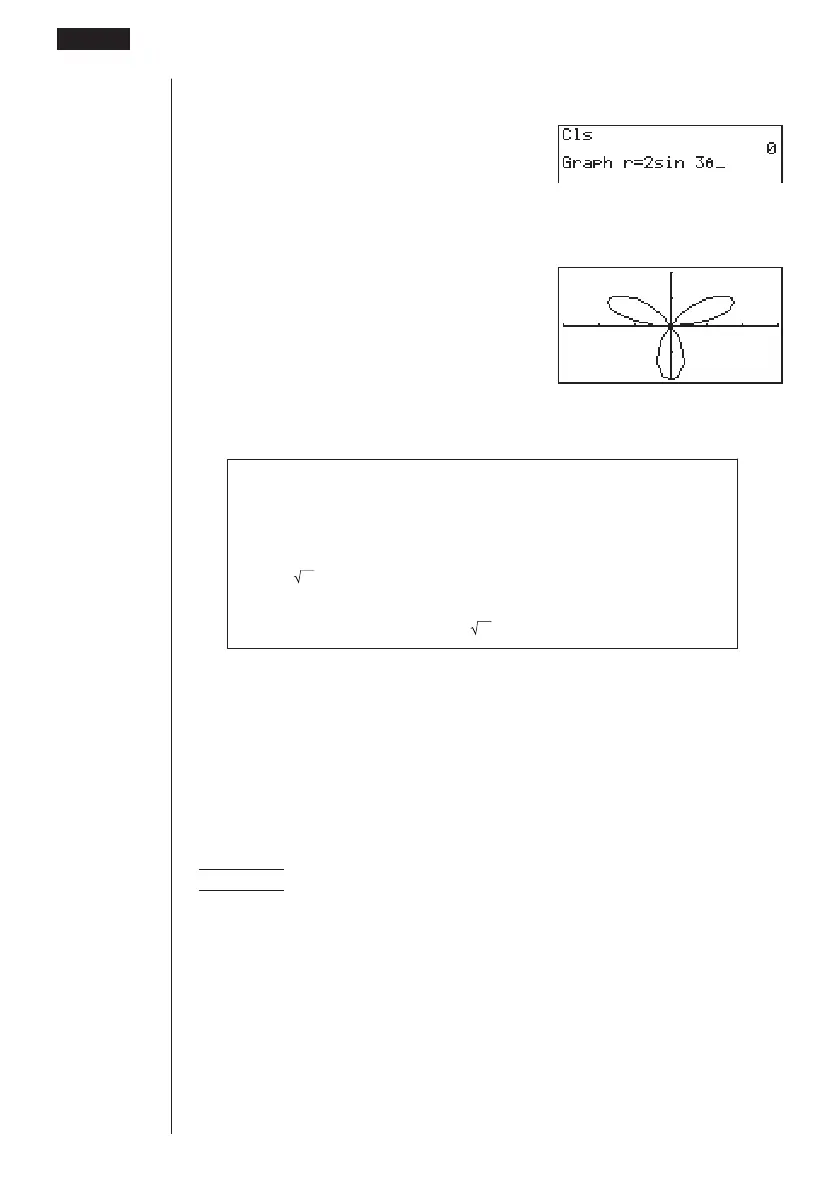
3. Input the polar coordinate expression (
r =).
!4(Sketch)1(Cls)w
5(GRPH)2(r =)
csdv
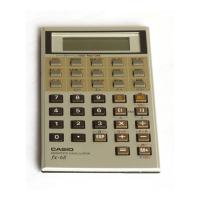
4. Press w to draw the graph.
w
• You can draw graphs of the following built-in scientific functions.
• sin
θ
• cos
θ
• tan
θ
• sin
–1
θ
• cos
–1
θ
• tan
–1
θ
• sinh
θ
• cosh
θ
• tanh
θ
• sinh
–1
θ
• cosh
–1
θ
• tanh
–1
θ
•
θ
•
θ
2
• log
θ
• ln
θ
• 10
θ
• e
θ
•
θ
–1
•
3
θ
• View Window settings are made automatically for built-in graphs.
uu
uu
uTo graph parametric functions
You can graph parametric functions that can be expressed in the following format.
(X, Y) = ( f (T), g (T))
Example To graph the following parametric functions:
x = 7 cos T – 2 cos 3.5T
y = 7 sin T – 2 sin 3.5T
Use the following View Window parameters.
Xmin = –20 Ymin = –12
Xmax = 20 Ymax = 12
Xscale = 5 Yscale = 5
T,
θ
min = 0 T,
θ
max = 4π
T,
θ
pitch = π÷36
8 - 5 Drawing Graphs Manually