225
14-2 Graphing an Implicit Function
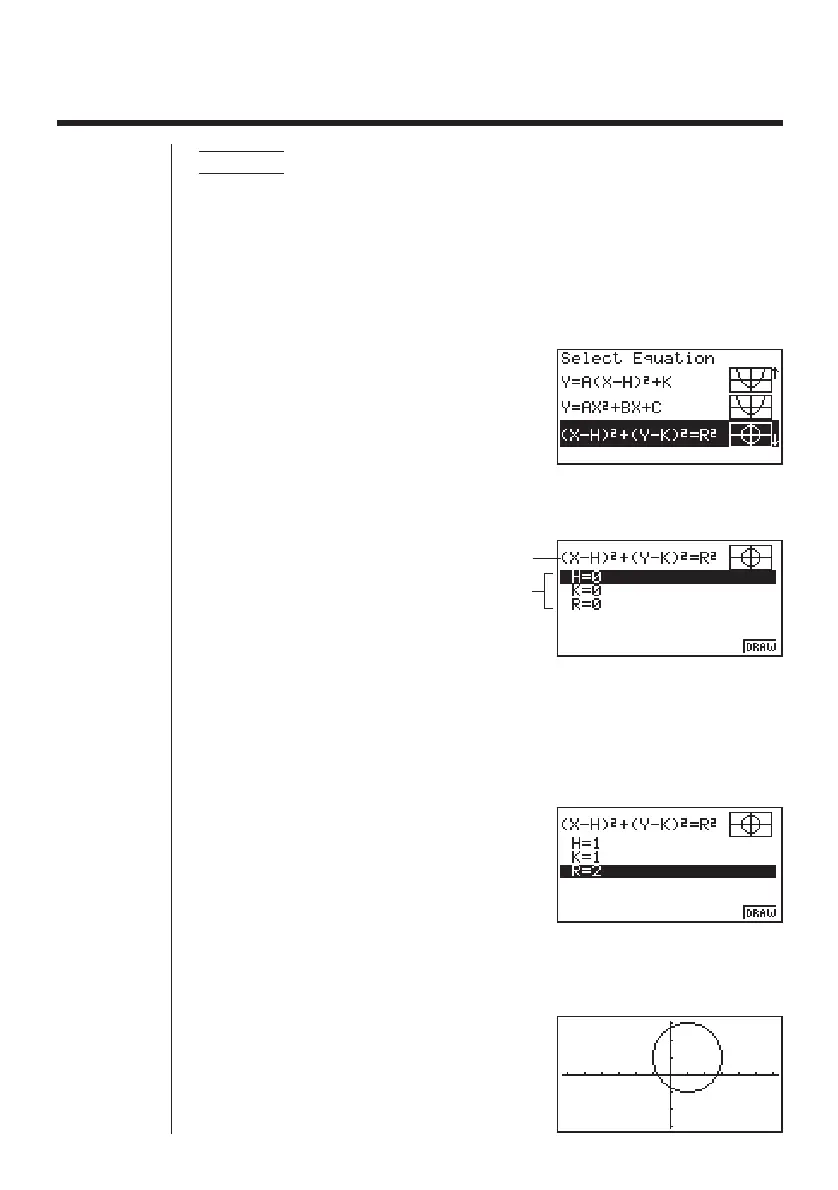
Example 1 To graph the circle (X – 1)
2
+ (Y – 1)
2
= 2
2
Use the following View Window parameters.
Xmin = –6.3 Ymin = –3.1
Xmax = 6.3 Ymax = 3.1
Xscale = 1 Yscale = 1
1. Select the function whose graph you want to draw.
cccc
2. Press w and the variable input screen appears.
w
Graph function
Function variables
• The values that appear are the values currently assigned to each variable, which
are general variables used by the calculator. If the values include an imaginary
part, only the real part appears on the display.
3. Assign values to each variable.
bw
bw
cw
• You can also use f and c to highlight a
variable and then input a value.
4. Press 6 (DRAW) to draw the graph.
6 (DRAW)
123456