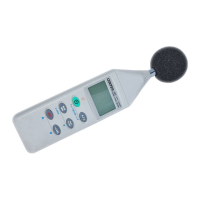
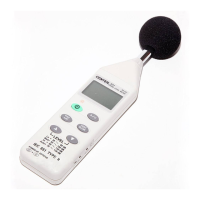
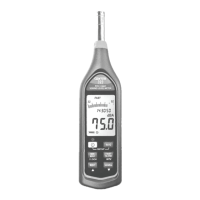
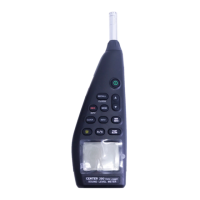
Sound Level Meter
12
executing SE323.
Main Menu:
File | Open- Retrieve files
Save - Save the active window (when the caption bar is highlighted) data to
file.
Print - Print the graph of the active window.
Printer Setup - Select printer.
File | Exit: Terminates SE323 program.
View | Control Panel: By opening the Panel Window, the user can control
meter via the button in this window.
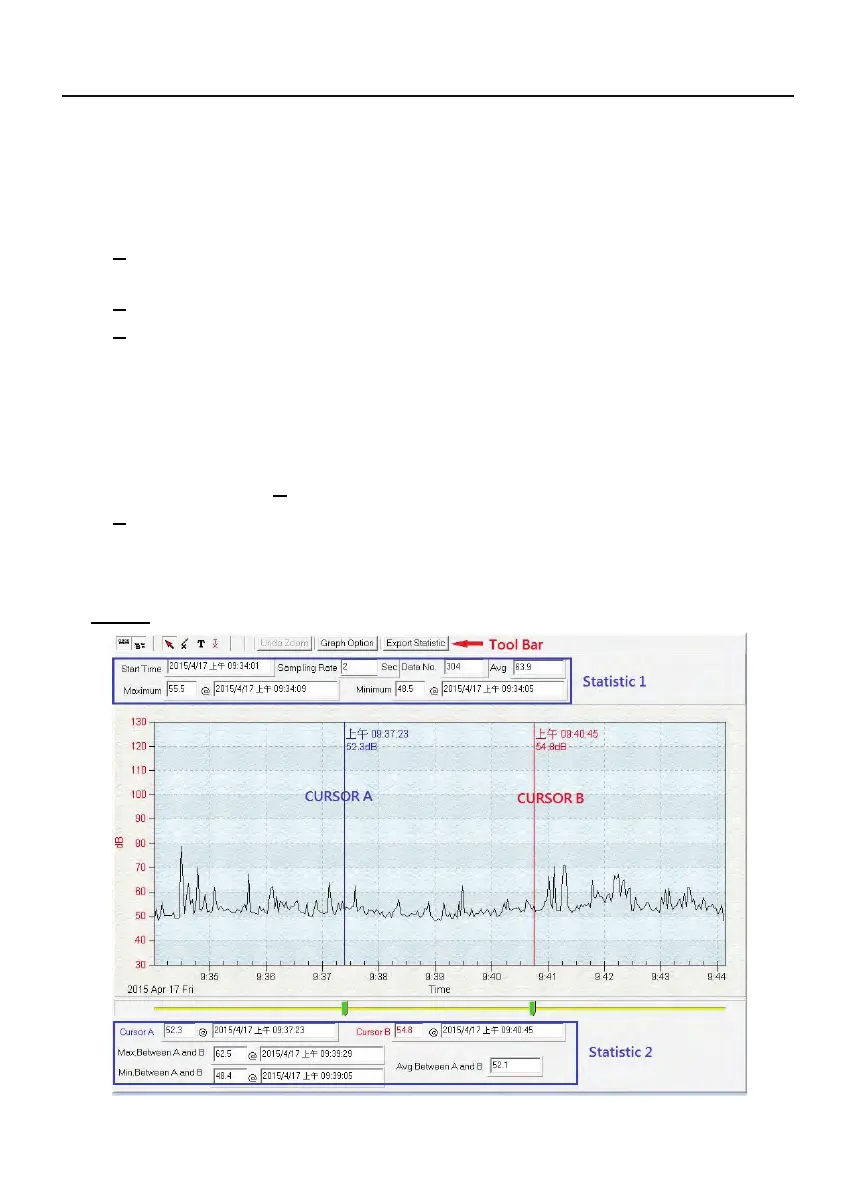
View | Real-Time Graph: Open Real-Time Graph display to graph the
present data.
Real Time Data | Run - Start collecting real time data.
Stop - Stop collecting real time data.
DataLogger: By opening the DataLogger Window, the user can load
recorded data of meter to PC in this window.
Graph