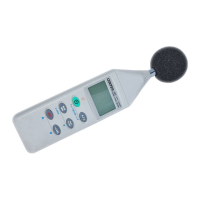
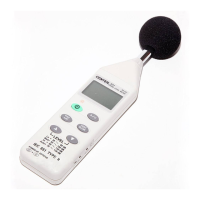
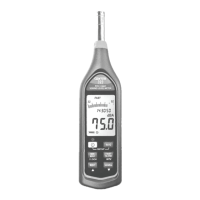
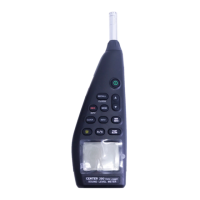
Sound Level Meter
13
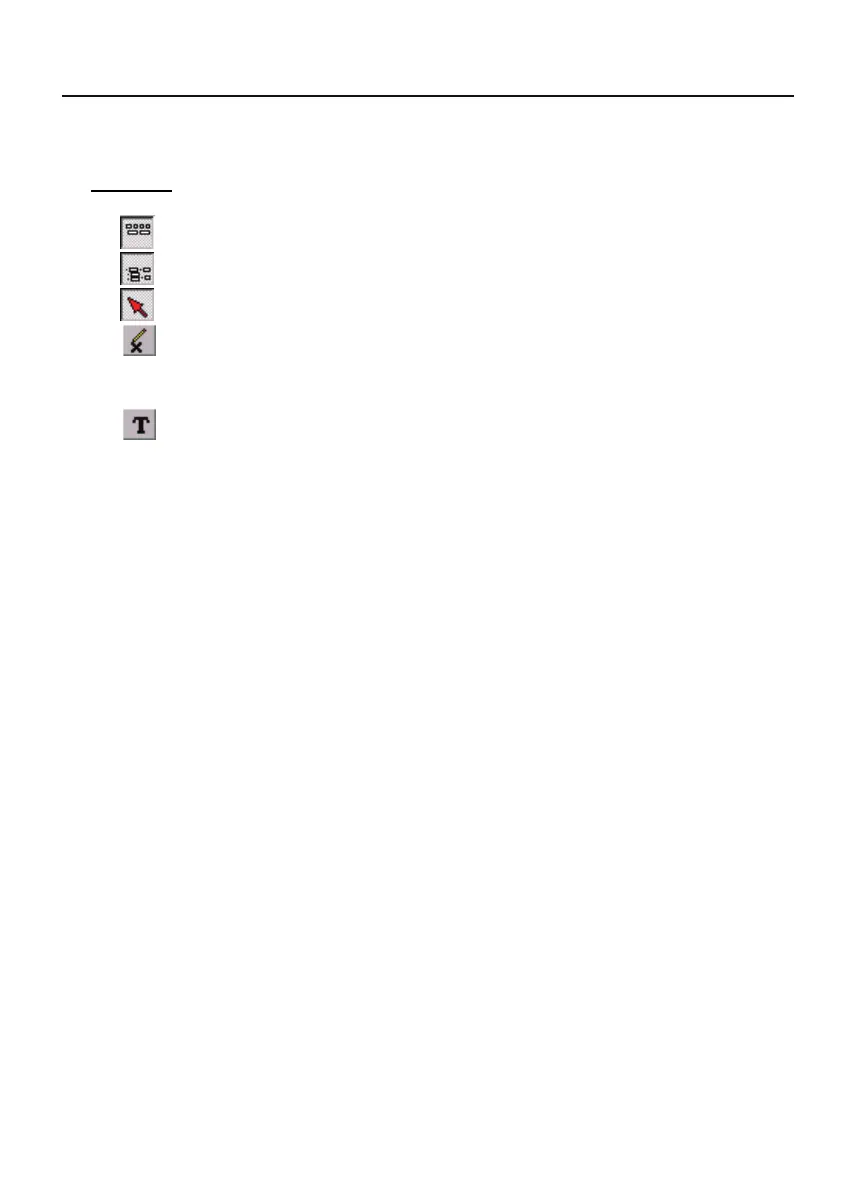
Tool Bar
- Display or hide Statistic1.
- Display or hide Statistic2.
- Normal cursor.
- When selected, the mouse cursor will become a cross sign when
moving to the graph, click on the graph to mark a cross sign on the
graph.
- When selected, the mouse cursor will become a "I" sign when
moving to the graph, click on the graph to annotate.
You can choose a rectangle area on the graph to zoom in for detail.
There are two vertical line (CURSOR A and CURSOR B) in the graph.
There are time and value display on top and right side of each cursor. You
can move mouse cursor over cursor A or B and click to drag cursor to move
left or right. Right below cursor A and B is a slider. You can also click and
drag slider to move cursor A or B. Below the slider is the statistic, it displays
start time, sampling rate, data number, maximum and minimum of the graph.
The statistic also displays the maximum, minimum and average between
cursor A and B and these data will update automatically when cursor A or B
is moving.
You can double click the graph to call the option dialog. In option dialog, it is
allowed to customize your graph style.
You can Zoom this graph by using mouse:
To Zoom:
(1) Press the left mouse button and drag the cursor to select the new
extents.
(2) Release the mouse button.
To Undo the Zoom - Right click on the graph, there will be a pop-up menu,
select Undo Zoom.