Programming 53
Cat. No. 01016370
Culligan MVP Control Statistic Functions
The Culligan MVP control has the ability to provide statistical information about the system. This data is accessed through the Statistics
key. To move through the statistical data available, use the “-” key. Each push of the “-” key will display new information. The follow-
ing table briefly defines the data available while in this mode. The actual data to be displayed will depend on your type of system (for
example, flow data is only show on units utilizing a flow meter).
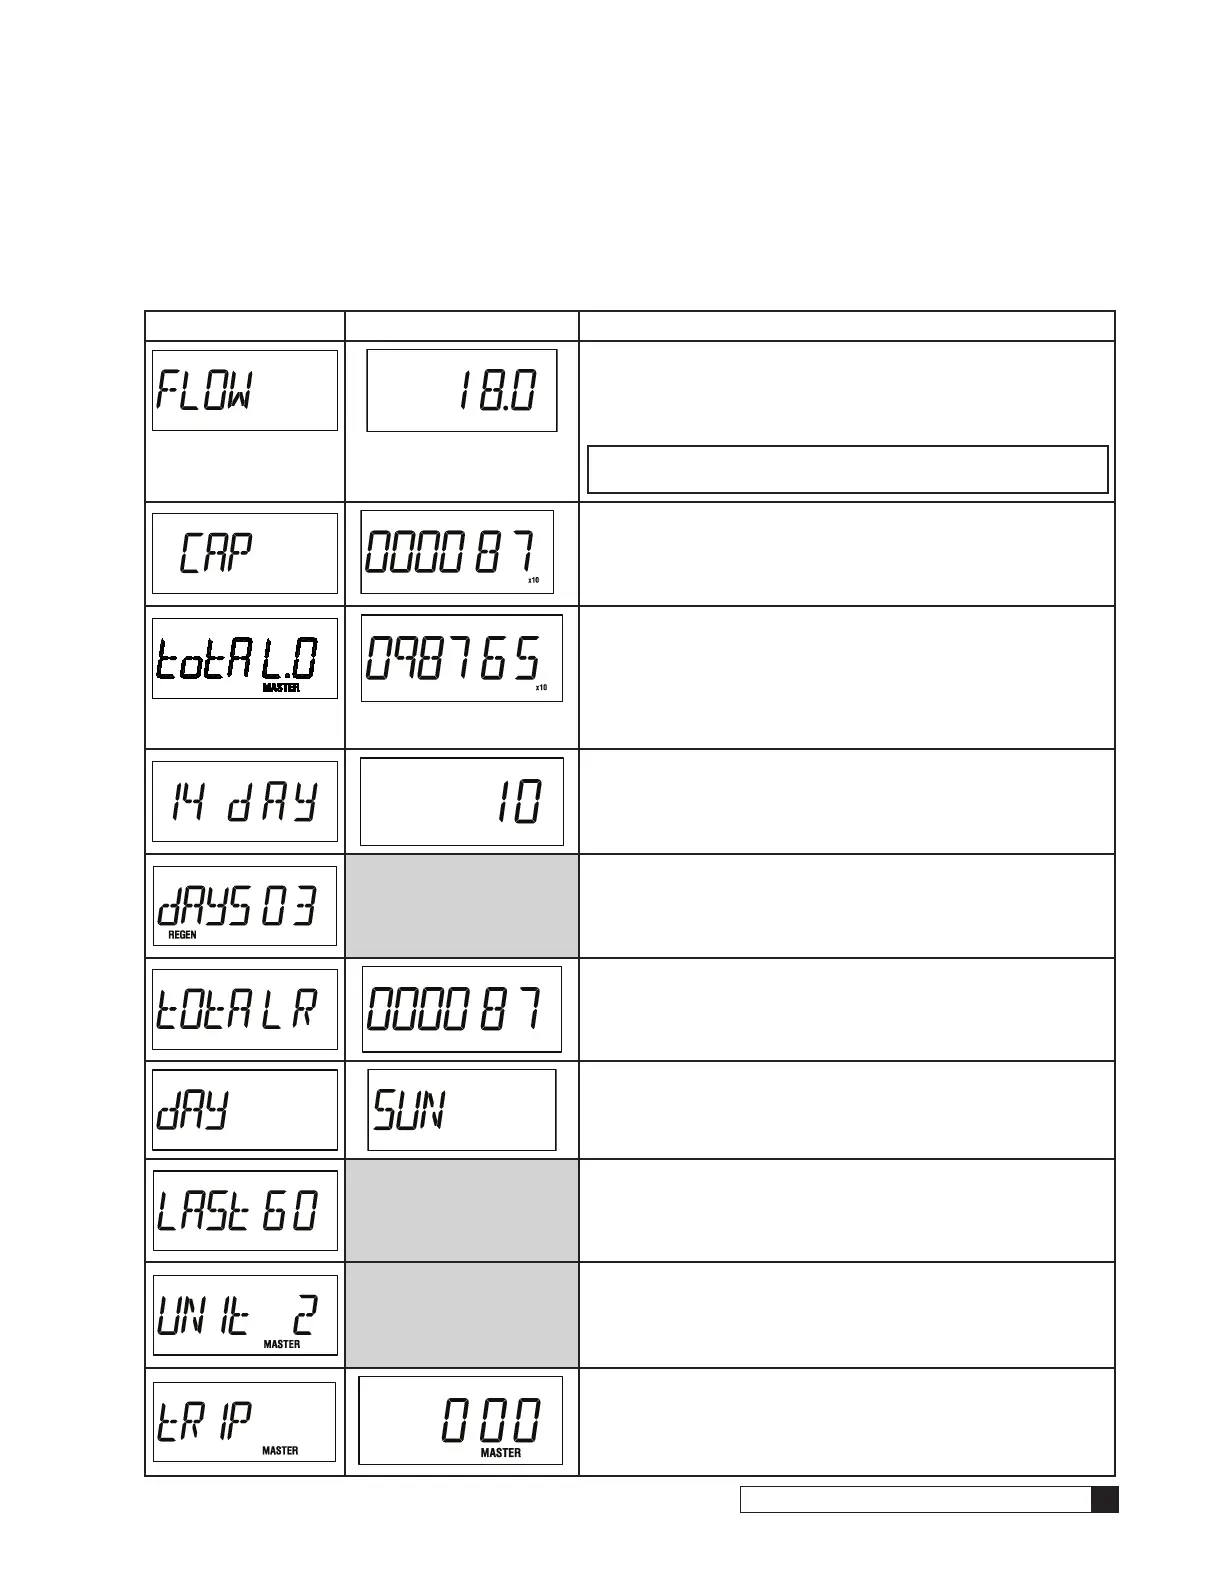
Display One Display Two (Example) Display Description
Flow rate of water passing through the unit. Display 1 will be shown for
2 seconds followed for 10 seconds by Display 2. It will repeat this cycle
as long as the “-” or Statistics key(s) are not pressed. Flow rate is deter-
mined using the following formula: Pulses per minute/ “K” factor per unit
= Displayed Flow Rate.
NOTE The MASTER unit will display the total system flow of all
online units.
Capacity Remaining - The capacity remaining in the batch before re-
generation will be initiated. The display will show Display 1 for 2 seconds
then show the remaining capacity (Display 2) for 10 seconds. It will re-
peat this cycle as long as the “-” or Statistics key(s) are not pressed.The
X10 or X100 icon shall also be illuminated (depending on DIP switch 2).
Total Flow Since Installation - The flow totalizer. This shows the total
amount of water that has passed through the individual unit since the unit
was installed. Display 1 will be shown for 2 seconds followed by the total
flow data (Display 2) for 10 seconds. The X10 or X100 icon shall also be
illuminated (depending on DIP switch 2). The .0 section of the display will
indicate the number of times the counter has rolled over up to 9 times.
After 9 rollovers, the counter starts at 0.
Number of Regenerations in the Last 14 Days - Display 1 will illumi-
nate for 2 seconds followed by the number of regenerations that the unit
has completed in the last 14 days (Display 2) for 10 seconds. The con-
troller will not count regenerations if stepped past the last cycle manually.
None
Number of Days Since Last Regeneration - Display 1 will illuminate to
indicate the number of days that have passed since the last regenera-
tion was completed. There is no Display 2. The controller will not count
regenerations if stepped past the last cycle manually.
Total Number of Regenerations for Life of Unit - Display 1 will illumi-
nate for 2 seconds followed by the number of regenerations that the unit
has completed since it was installed (Display 2) for 10 seconds.
Current Day of Week - If operating as a single unit and the unit is pro-
grammed to regenerate on a specific day of the week, Display 1 will illu-
minate for 2 seconds followed by the current day of the week (Display 2).
None
Last Slow Rinse Time - If operating with an Aqua-Sensor Display 1 will
illuminate and indicate the number of minutes of the last slow rinse cycle as
controlled by the Aqua-Sensor device.
None
# Connected Units - The display indicates the number of controls in the
system. It will only be displayed if ID#’s have been assigned and saved in
EEPROM, if DIP switch 9 is ON or if the control is the MASTER unit in a
multiple control system.
Progressive Flow Trip Point - This shows the programmed trip point
for the progressive ow feature only in a MASTER unit. Display 1 will be
shown for 2 seconds followed by the trip point in ow units per minute
(Display 2).
 Loading...