Display Analysis
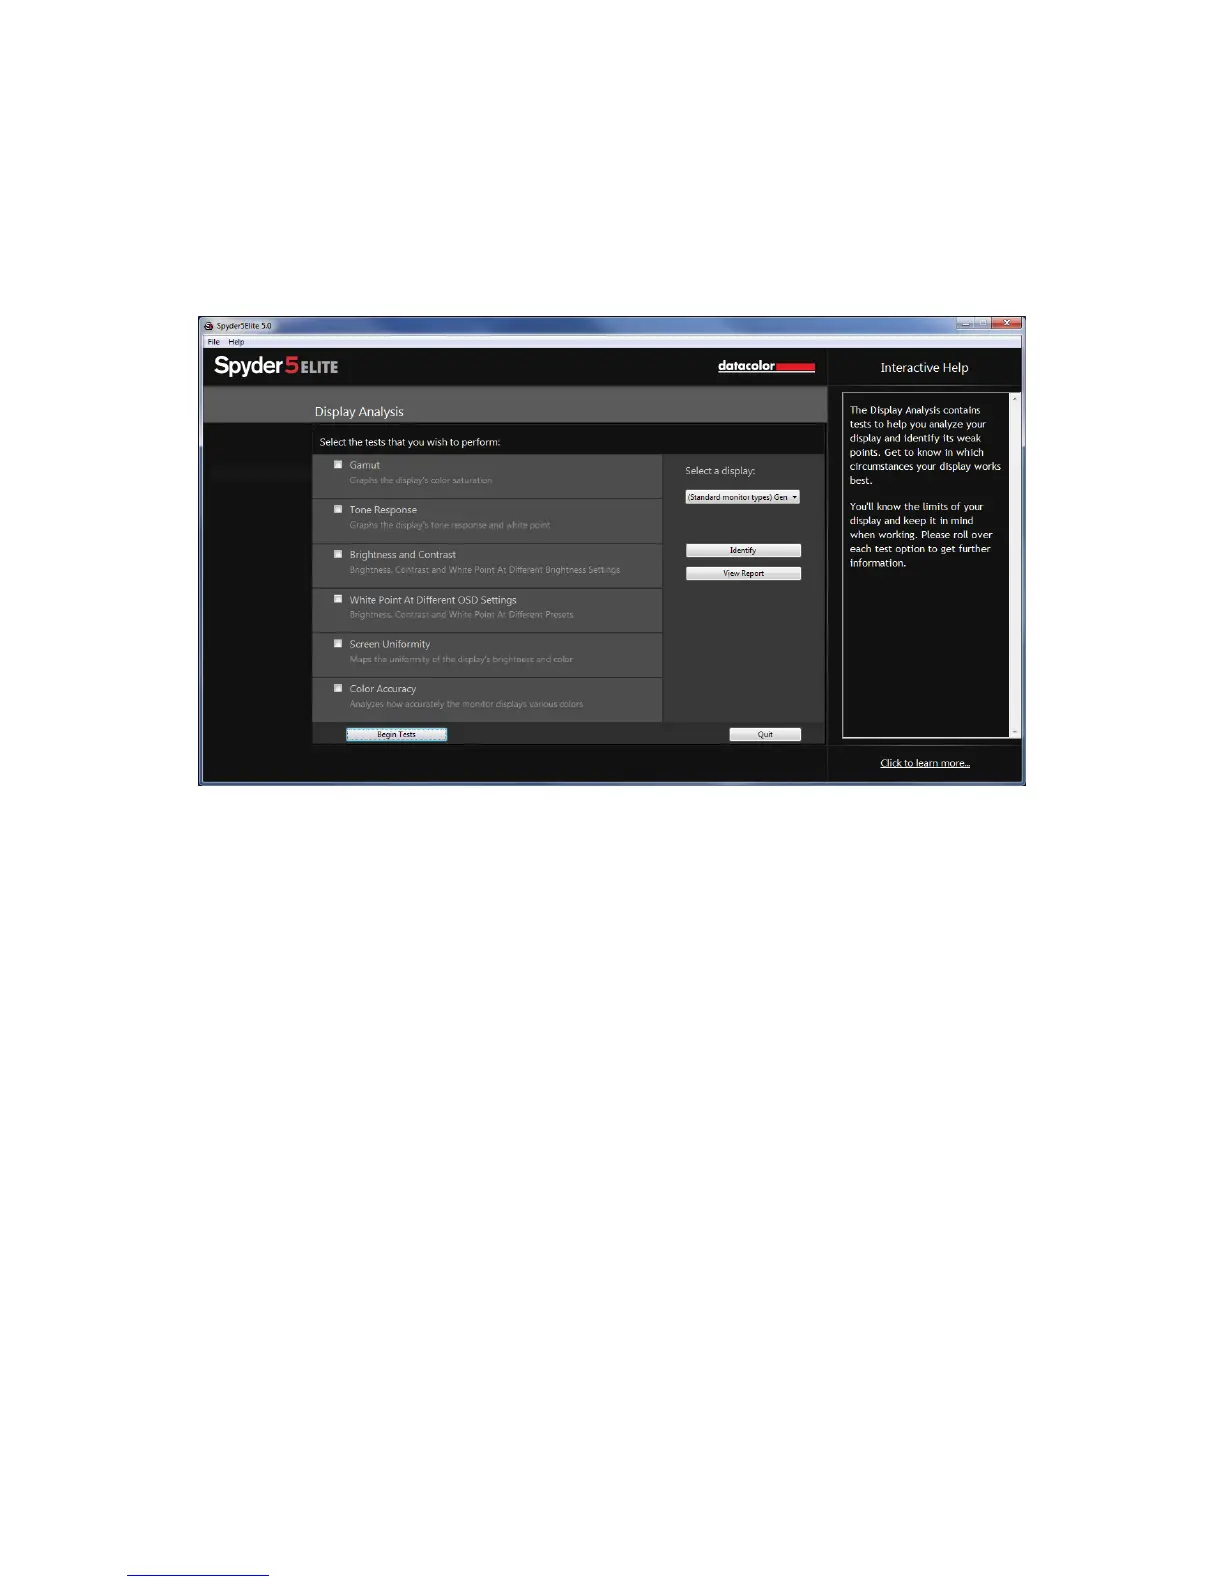
This is a series of 6 tests you can perform on your monitor to see its strengths and
weaknesses. You can access these tests through the “Shortcuts” dropdown or
directly from the Spyder5 program folder at /Support/Spyder5EliteMQA.
These tests include:
Gamut
Graphs the display’s color saturation
Tone Response
Graphs the display’s tone response and white point
Brightness and Contrast
Brightness, Contrast and White point at different Brightness settings
White Point at Different OSD Settings
Brightness, Contrast and White Point at Different presets
Screen Uniformity
Maps the uniformity of the display’s brightness and color
Color Accuracy
Analyze how accurately the monitor displays various colors
Select the tests you wish to perform and then click “Begin Tests.” The software will
walk you through where to place the sensor and direct you when to change the
brightness on your display.