2
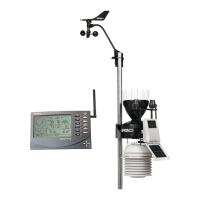
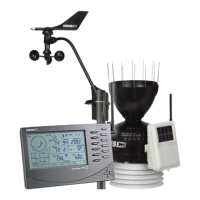
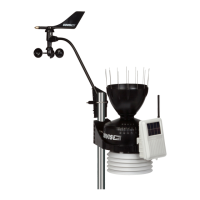
Wireless Vantage Pro2
™
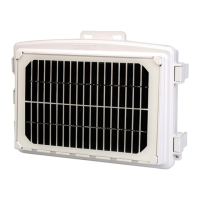
ISS Dimensions:
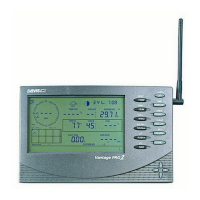
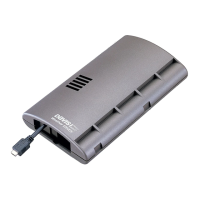
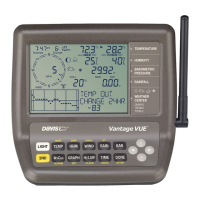
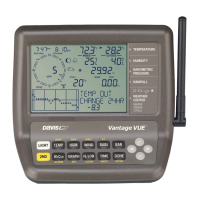
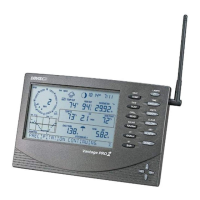
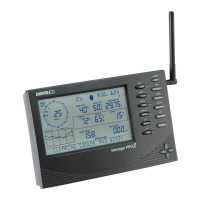
Console
Console Operating Temperature . . . . . . . . . . . . . . . . . . . +32° to +140°F (0° to +60°C)
Non-Operating (Storage) Temperature . . . . . . . . . . . . . . . +14° to +158°F (-10° to +70°C)
Current Draw . . . . . . . . . . . . . . . . . . . . . . . . . . . . . . . . . 0.9 mA average, 30 mA peak, (add 120 mA for display lamps, add 0.125 mA for
each optional wireless transmitter received by the console) at 4 - 6 VDC
AC Power Adapter . . . . . . . . . . . . . . . . . . . . . . . . . . . . . . 5 VDC, 300 mA, regulated
Batteries . . . . . . . . . . . . . . . . . . . . . . . . . . . . . . . . . . . . . 3 C-cells
Battery Life . . . . . . . . . . . . . . . . . . . . . . . . . . . . . . . . . . . up to 9 months
Connectors . . . . . . . . . . . . . . . . . . . . . . . . . . . . . . . . . . . Modular RJ-11
Housing Material . . . . . . . . . . . . . . . . . . . . . . . . . . . . . . . UV-resistant ABS plastic
Console Display Type . . . . . . . . . . . . . . . . . . . . . . . . . . . LCD Transflective
Display Backlight . . . . . . . . . . . . . . . . . . . . . . . . . . . . . . . LEDs
Console Dimensions
Console with antenna down (L x H x D) . . . . . . . . . . 10.625" x 6.125" x 1.625" (270 mm x 156 mm x 41 mm)
Console with antenna extended up (L x H x D) . . . . . 10.625" x 9.625" x 1.625" (270 mm x 245 mm x 41 mm)
Display (L x H) . . . . . . . . . . . . . . . . . . . . . . . . . . . . . 5.94" x 3.375" (151 mm x 86 mm)
Weight (with batteries) . . . . . . . . . . . . . . . . . . . . . . . . . . . 1.88 lbs. (.85 kg)
Data Displayed on Console
DatadisplaycategoriesarelistedwithGeneralfirst,then inalphabeticalorder.
General
Historical Data . . . . . . . . . . . . . . . . . . . . . . . . . . . . . . . . . Includes the past 24 values listed unless otherwise noted; all can be cleared and
all totals reset
Daily Data . . . . . . . . . . . . . . . . . . . . . . . . . . . . . . . . . . . . Includes the earliest time of occurrence of highs and lows; period begins/ends at
12:00 am
Monthly Data . . . . . . . . . . . . . . . . . . . . . . . . . . . . . . . . . . Period begins/ends at 12:00 am on the first of the month
Yearly Data . . . . . . . . . . . . . . . . . . . . . . . . . . . . . . . . . . . Period begins/ends at 12:00 am on the first of January unless otherwise noted
Current Display Data . . . . . . . . . . . . . . . . . . . . . . . . . . . . Current display data describes the current reading for each weather variable. In
most cases, the variable lists the most recently updated reading or calculation.
Some current variable displays can be adjusted so there is an offset for the reading
Current Graph Data . . . . . . . . . . . . . . . . . . . . . . . . . . . . . Current graph data appears in the right-most column in the console graph and
represents the latest value within the last period on the graph; totals can be set or
reset. Display intervals vary. Examples include: Instant, 15-min., and Hourly
Reading; Daily, Monthly, High and Low
Graph Time Interval . . . . . . . . . . . . . . . . . . . . . . . . . . . . 1 min., 10 min., 15 min., 1 hour, 1 day, 1 month, 1 year (user-selectable, availability
depends upon variable selected)
Graph Time Span. . . . . . . . . . . . . . . . . . . . . . . . . . . . . . . 24 Intervals + Current Interval (see Graph Intervals to determine time span)
Graph Variable Span (Vertical Scale) . . . . . . . . . . . . . . . . Automatic (varies depending upon data range); Maximum and Minimum value in
range appear in ticker
Alarm Indication . . . . . . . . . . . . . . . . . . . . . . . . . . . . . . . . Alarms sound for only 2 minutes (time alarm is always 1 minute) if operating on
battery power. Alarm message is displayed in ticker as long as threshold is met or
exceeded. Alarms can be silenced (but not cleared) by pressing the DONE key.
Transmission Interval . . . . . . . . . . . . . . . . . . . . . . . . . . . . Varies with transmitter ID code from 2.25 seconds (#1=shortest), to 3 seconds
(#8=longest)
Update Interval . . . . . . . . . . . . . . . . . . . . . . . . . . . . . . . . Varies with sensor - see individual sensor specs
Product # (Length x Width x Height) Package Weight
6152
11.00" x 9.38" x 14.00"
(279 mm x 238 mm x 355 mm)
5.7 lbs. (2.6 kg
)
6162
6.1 lbs. (2.6 kg)
6153
11.00" x 9.38" x 21.00"
(279 mm x 238 mm x 533 mm)
8.6 lbs. (3.9 kg)
6163 9 lbs. (4.1 kg)