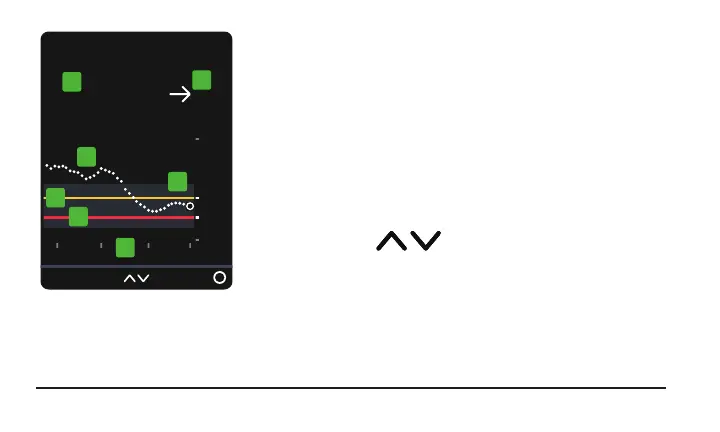
1. Number: The most recent sensor reading.
2. Trend arrow: Where glucose is heading based on
the last few readings.
3. Trend graph: The bigger dot on the right is the
most recent sensor reading. The smaller dots show
past readings.
4.
3 Hours Change the number of hours
shown on the trend graph using the arrow buttons.
20