12
Explore Your Map & Take Acon
• Easily apply dierent plant health
algorithms to help highlight variaon
in crops. We suggest you use the
VARI index, an algorithm similar
to NDVI, but intended for visual
spectrum (Red Green Blue or RGB)
imagery. Like NDVI, VARI uses red,
yellow and green coloraon to
highlight areas of poor, medium and
strong plant health.
• Use annotaons and measurements
to mark areas to ground-truth, then
take your map out into the eld with
you to take notes. You can even add
photos to your comments!
• Connect other members of your team
by sharing your map and comments.
• Want to make prescripons or
esmate damage? Combine plant
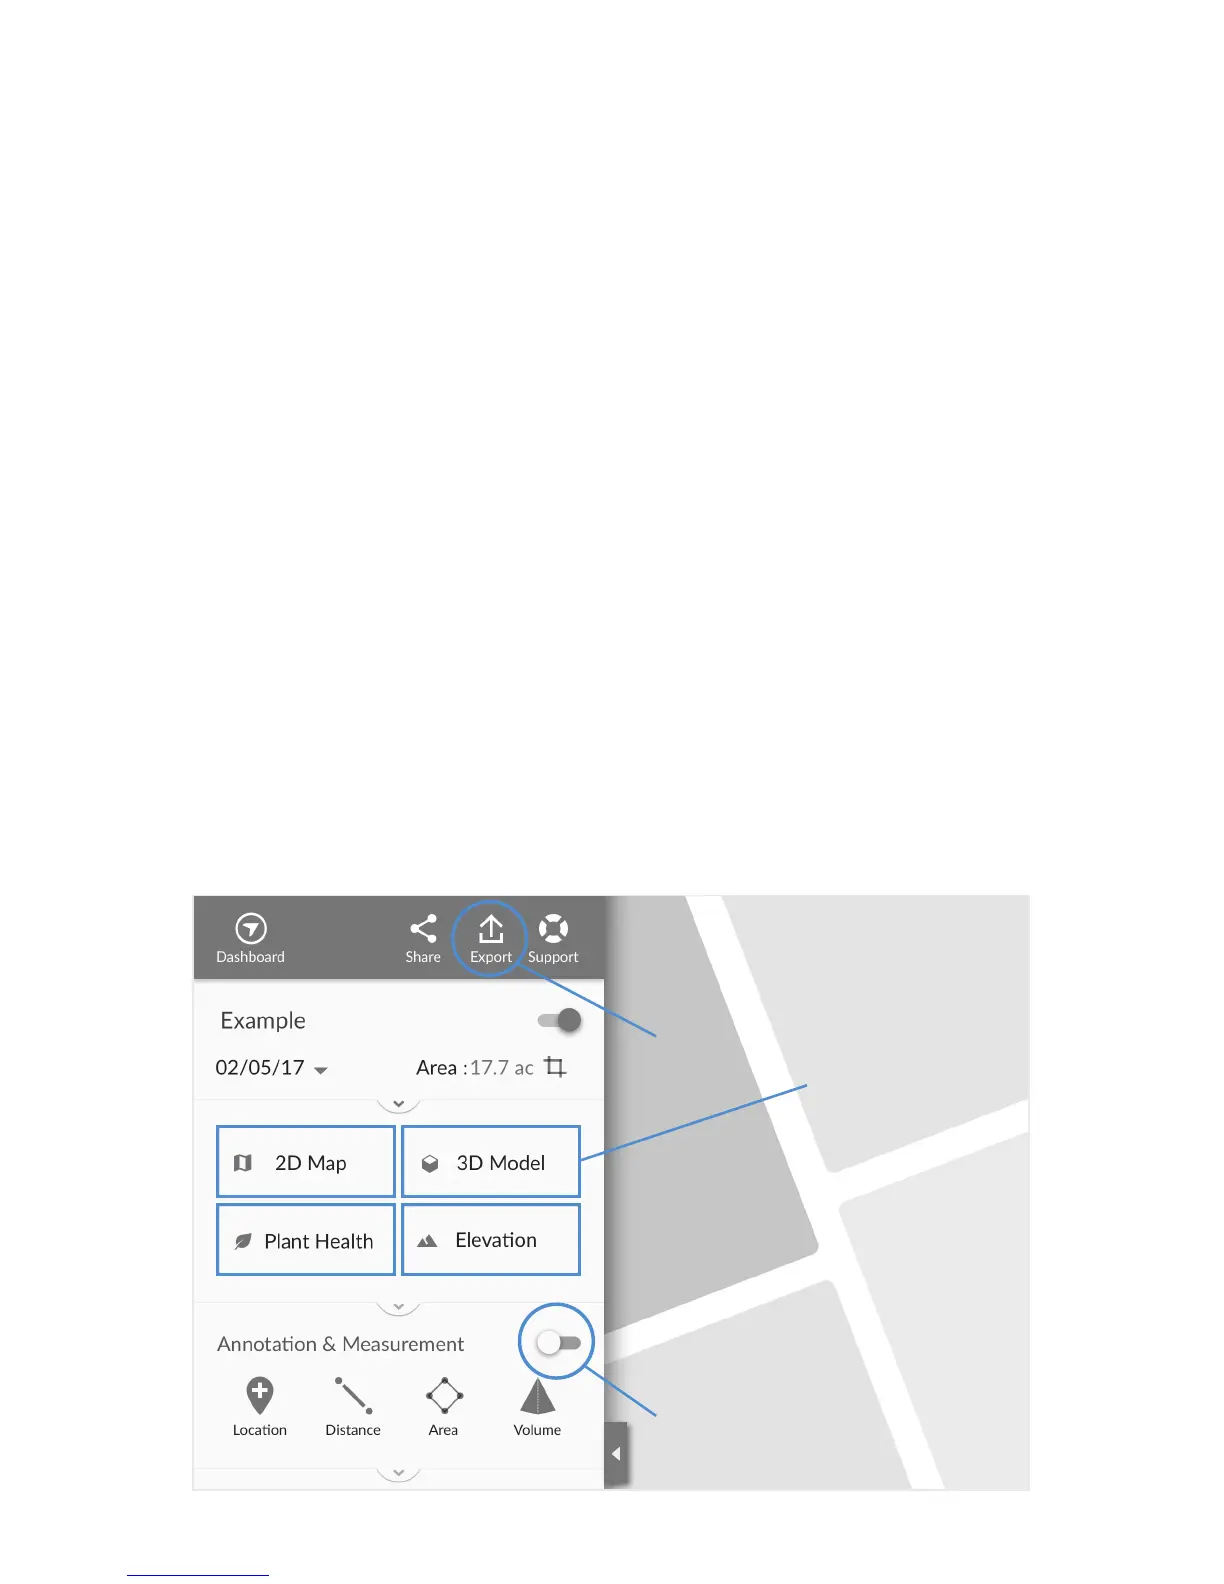
Export the
selected layer
Turn annotaons &
measurements on/o
Data layers
available
health algorithms with management
zone and grid tools to measure
health and unhealthy acres. Even
export a shapele that can be
imported into a Farm Management
System and combined with other
data such as topography, soil, or
historic yield data to make a variable
rate prescripons.
• Export maps in a variety of formats
or leverage tools from the App
Market to generate specialized
reports, including:
» Stand analysis
» Plant count
» Crop damage assessment
» Annotaons report
Figure E. Explore Your Map on Any Device

 Loading...