Do you have a question about the Eaton Power Xpert 1000 and is the answer not in the manual?
Describes how to establish a new connection to the meter.
Details how to configure connection parameters for communication.
Explains the process of adding a new device to communicate with the software.
Outlines the steps to initiate a connection with the device.
Provides methods for accessing help documentation and support.
Describes the main window layout and its components.
Details the functions available within the main menu.
Explains the icons and functions available on the toolbar.
Covers the initial steps for setting up and performing basic monitoring.
Details how to manage connected devices within the software.
Explains how to configure and manage data logging features.
Details the various settings for configuring data logging parameters.
Highlights important considerations for data logging operations.
Steps to initiate the data logging process.
Instructions on how to find and analyze logged data files.
Describes the items and structure found within a data log file.
Guides on importing and exporting device configuration profiles.
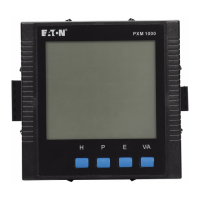
Introduces functions specific to the PXM1000 series devices.
Explains how to view various readings and data from the meter.
Details how to view and potentially modify energy-related readings.
Explains how to view voltage and current spectrum data.
Describes the display and interpretation of sequence component diagrams.
Explains the input/output module parameters and their display.
Details methods for retrieving and viewing data logs.
Explains how to retrieve and view waveform data.
Introduces the various configuration settings available for the device.
Covers general settings for serial and network connections.
Details settings for input/output modules, including AO transfer curves.
Explains how to configure alarm limits and settings.
Provides information on data logging parameters and limits.
Describes Time of Use (TOU) settings and formats.
Details how to configure TOU settings related to holidays.
Explains how to configure pulse input settings and advanced options.
Covers advanced options for configuring analog input categories and units.
Addresses common problems and provides solutions for the software.
Step-by-step guide for installing the PXM1000 software.
Instructions for removing the PXM1000 software from the system.
Lists the minimum system requirements for running the software.
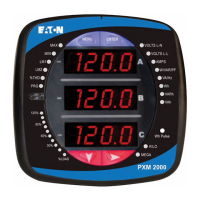
The Eaton PXM1000 software is designed for the PXM 1000 series power meters, providing a user-friendly interface for real-time monitoring and data logging. This tool enables continuous monitoring of multiple parameters, facilitating energy saving and power quality analysis, and allowing users to maintain the meter on a real-time basis.
The software's core functions revolve around device communication, monitoring, data logging, and configuration.
The PXM1000 software allows users to add new connections and devices, set connection parameters, and then connect to these devices to read measurement data. Users can view measured values by navigating a menu tree, with the displayed content varying based on the device type. The connection can be stopped at any time.
Users can add new devices and manage existing ones. If an unused device window is present, it can be selected to make the device status "available" by clicking the Device Properties menu or icon. Unneeded device windows can be deleted. The Device Manager provides a comprehensive overview of all available devices, displaying their detailed communication status, including the total number of devices, normally communicating devices, communication failures, log-enabled devices, and log failure totals. Counters can be reset, and device properties can be modified.
A critical feature is data logging, which requires prior setup. Users can access Data Log Settings through the Settings menu or a dedicated icon. Within these settings, a device list shows all devices in data logging mode, allowing users to enable or disable logging for each. Users can select one or more logging items, such as Real-Time Metering, Demand, Energy (Real-Time), Energy (TOU), Pulse Input, DI Counter, Analog Input, Harmonics (THD), Harmonic Spectrum, and Phase Angles.
Logging options include setting the data logging interval (in minutes or seconds), defining when a new log file should be created (either when the file is full, with a maximum of 64,800 rows, or after a specified duration), and choosing the log file format (.txt, .csv, or .xls, with .txt recommended). Users can also set column display names for Pulse Input and Analog Input items. The log file name can be customized, or the default name can be used. A specific folder location for log files can be set, with D:\MonData in the PXM1000 installation directory being the default.
To initiate data logging, users must connect to the device and then select "Start Data Logging." Logging can be stopped at any time. Log files are stored with names consisting of the device description, type, port (Serial mode) or IP address (Ethernet mode), device address, and logging start time (YYYYMMDD format).
The software supports importing and exporting device profiles. A device profile, containing settings, can be loaded into the current active device window. To send an imported profile to a device, users must first connect and then use the "Import and Update Device" tool. Current window settings can be saved as a file via "Export Device Profile."
D:\MonData in the PXM1000 installation directory.| Input Frequency | 50/60 Hz |
|---|---|
| Accuracy | ±1% |
| Display Type | LCD |
| Weight | Approx. 0.4 kg |
| Operating Temperature | 32°F to 104°F (0°C to 40°C) |
| Storage Temperature | -40°C to +85°C |
| Humidity | 5% to 95% RH, non-condensing |
| Safety Certifications | CE |