EC9830 CO ANALYZER OPERATION MANUAL
3-10 98307600 Rev. C-1
DifferencePercent 100
ionConcentrat Calculated - Response Instrument
=×
If the difference between values is less than 1% then the instrument is within
specifications. Otherwise a Leak Check and or service are required.
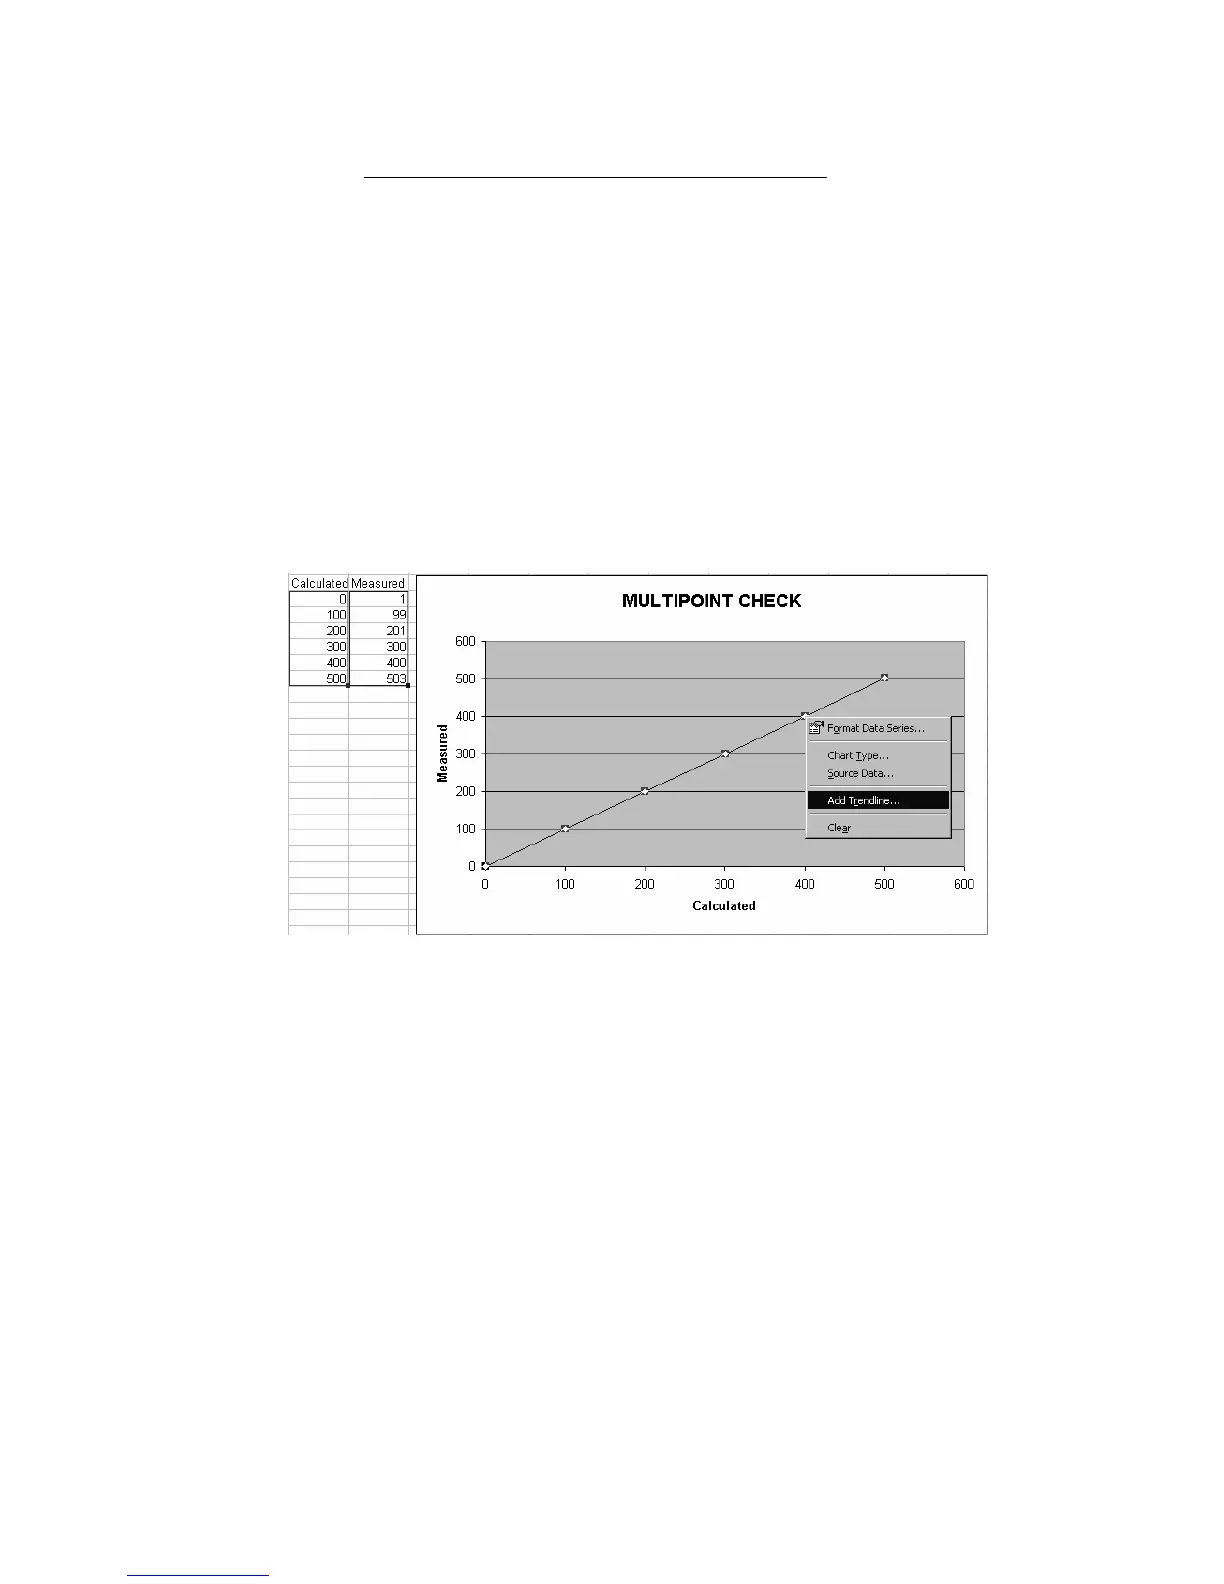
3.2.2.4.2 Using Microsoft Excel to Display Multipoint Calibration
Results
Produce an X Y scatter plot of the data with the calculated CO concentration in
the X axis and the instruments response concentration in the Y axis. Right mouse
click on any data point to bring up the data formatting menu shown in Figure 3-3.
Figure 3-3. Data point formatting menu with Excel chart