CHAPTER 3, CALIBRATION
98307600 Rev. C-1 3-11
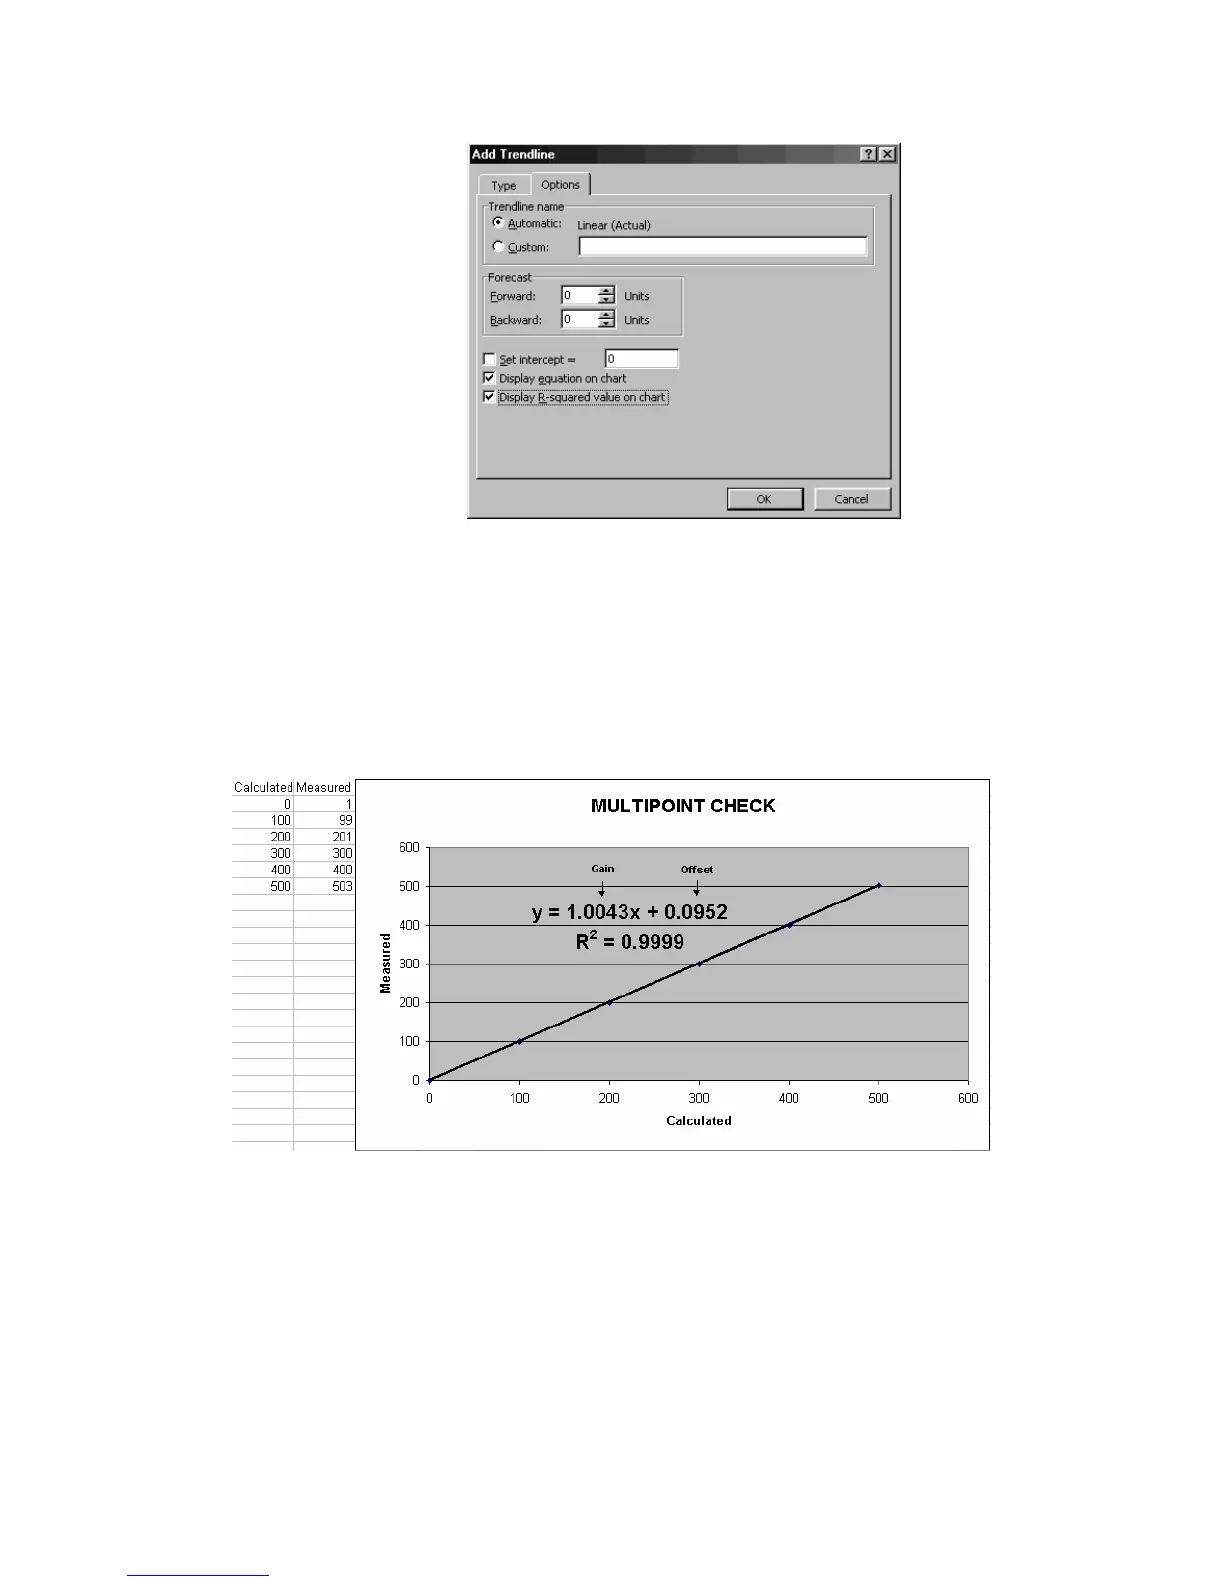
Figure 3-4. Trendline menu in Excel
Select Add Trendline (Linear should be selected under the TYPE tab) and enter
Options. Select the tick boxes that will display the equation and the R
2
value on
the chart (Figure 3-4). Clicking OK will return to the chart and display the
required data necessary to determine the effectiveness of the calibration.
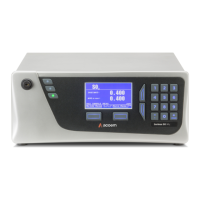
Figure 3-5. Excel chart showing equation with required criteria
Using the linear regression equation y = mx + b from the chart where:
y = instrument concentration (ppm)
x = calculated value (ppm)
m = gradient (gain)
b = y-intercept (offset)