EKO INSTRUMENTS CO., LTD. - Pyranometer MS-80/80S/80U - Instruction Manual Ver. 1
Pg. 54
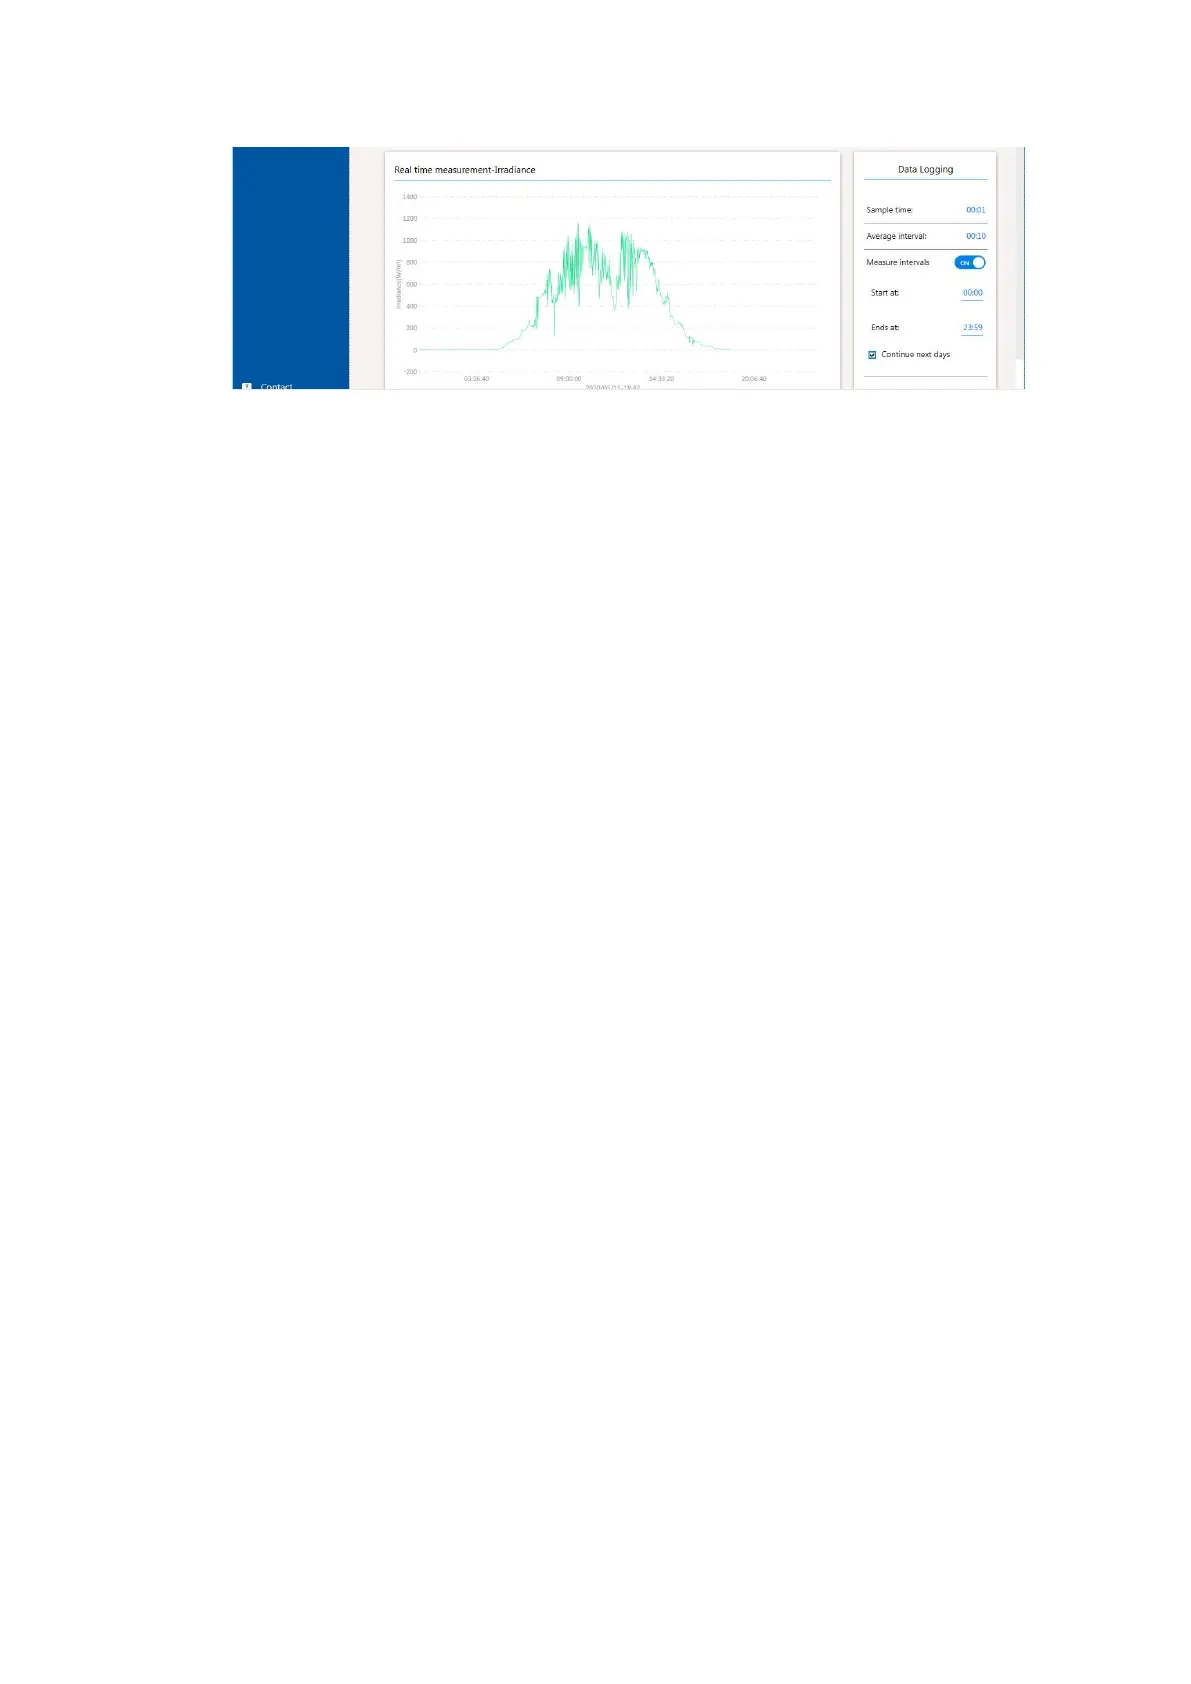
【Real-time measurement view】
<Real time measurement-Irradiance>
- Display measured irradiance data in a graph (1-second update).
- Drag the graph to change the horizontal axis position and use the mouse wheel to zoom in
or out on the desired area.
- The time range of the graph is 00:00:00 to 23:59:59.
- Clicking “Back to default” resets the change of the setting of the graph.
<Data Logging>
Logging function of measurement data
“Sample time:” Set the logging interval for measurement data.
Setting range: 00:01~01:00 (1 sec to 1 min)
“Average interval:” Set the logging interval for averaged measurement data.
Setting range: 00:01~01:00 (1 sec to 1 min)
“Measure intervals:” Set the time interval for data logging.
By checking "Continue next days", it is also possible to keep setting
after the next consecutive days.
“Start at:” Set the start time for data logging.
“Ends at:” Set the end time for data logging.
※ Setting across the day is not possible. The start time must be
earlier than the end time. (Start time < End time)
“LOG DATA buttons:” Click to start logging measurement data.
When "STOP" is clicked while measurement data is being logged,
logging stops.
Figure A3-21. Real-time measurement view