44 / EN
User Menu
System info
System info
SW Version interface
00.03.02
Zone number
1
System Performance
>
Diagnostics
>
Fig. 51
SW VERSION INTERFACE
Shows the device’s software version.
ZONE NUMBER
Shows the zone associated with the device.
SYSTEM PERFORMANCE
System Performance
Energy metering
>
SCOP
3,5
SEER
3,2
CO2 saved
100kg
Showers n°
5
Report Reset
>
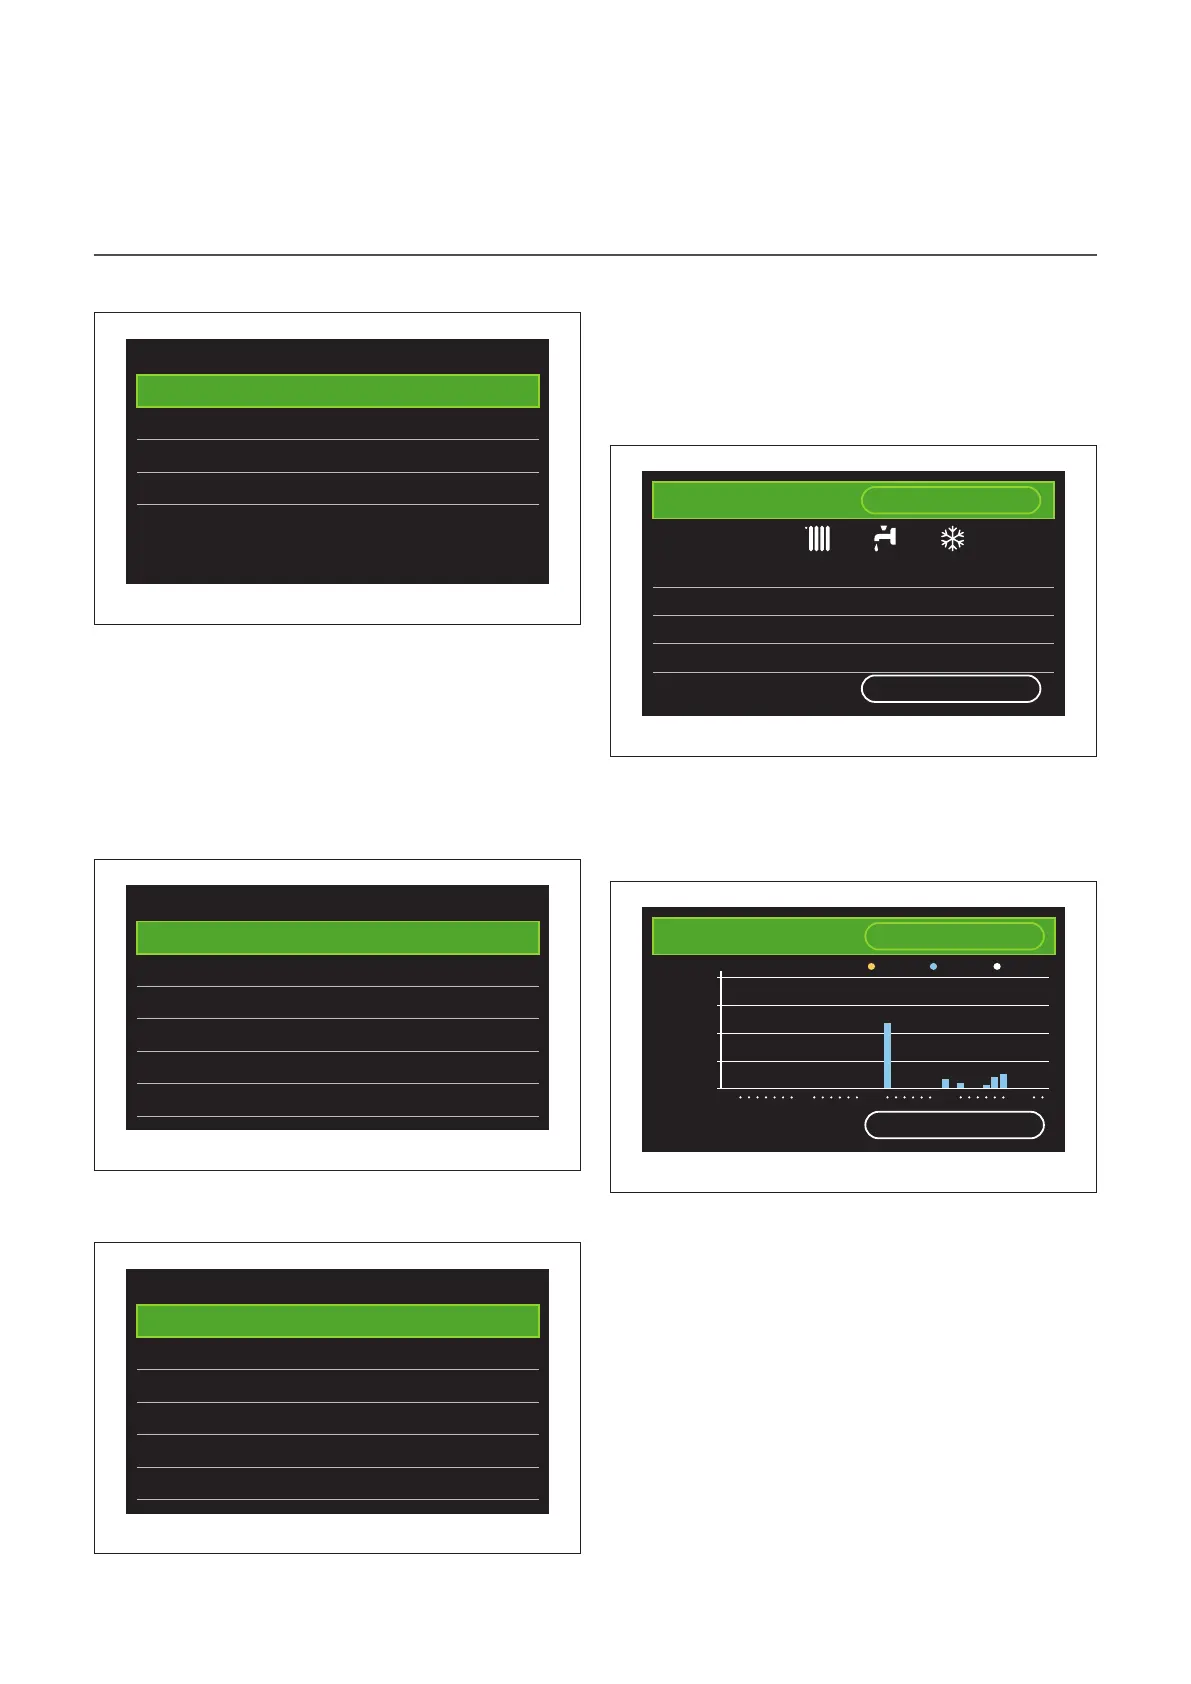
Fig. 52
ENERGY CONSUMPTION
Energy metering
Consumptions graph
>
Consumption table
>
Production graph
>
Units of measure and costs
>
Fig. 53
– "Consumptions graph": refer to the paragraph “Con-
sumptions graph”.
– "Consumption table": Shows the estimate in numeri-
cal format for consumption in heating, cooling and DHW
modes. The estimate is calculated based on the selected
measurement unit and on consumption information from
the current or previous year.
Type
Gas [kWh]
TOT
January 0 0 0 0
February 0 0 0 0
March 0 0 0 0
April 0 0 0 0
Time base
Running year
Fig. 54
– "Production graph": shows through histograms the esti-
mate of the thermal energy produced. The estimate is cal-
culated according to the type of generator present in the
system in the heating, DHW and cooling modes.
Type
TOT
Tot: 8 kWh
8
6
2
0
4
kWh
CH DHW COOL
1 8 15 22 29
Time base
Running month
Fig. 55