PowerPackPro will automatically open a graph after a survey has been
successfully downloaded. Graphs may also be opened by clicking on the relevant
survey in the survey list, or via the icon.
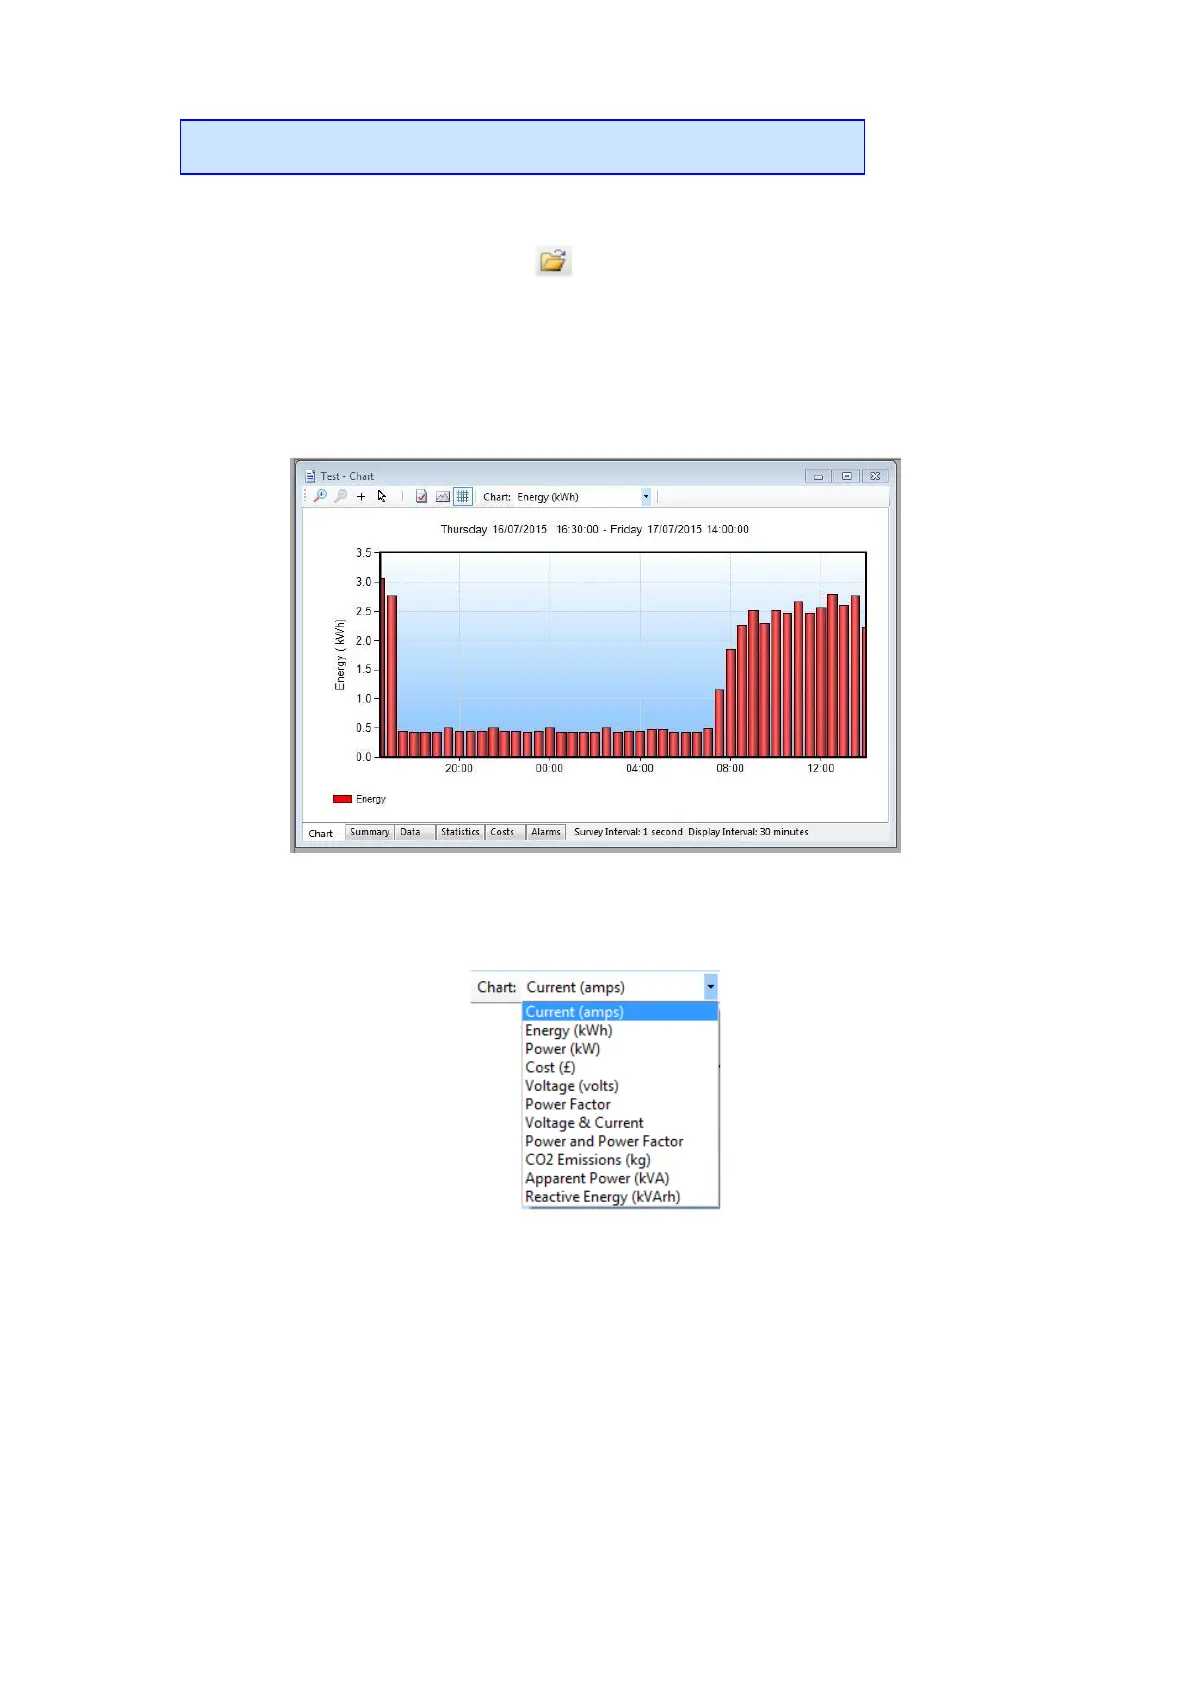
Depending on the length of the downloaded survey, the default settings will
create a graph of the entire survey, or in the case of longer surveys create a
graph using a 30 minute data interval with an initial view of a 1 week period.
These settings may be altered manually if desired. PowerPackPro is shipped with
a SPCPro2 sample survey pre-loaded which is used in the following pages.
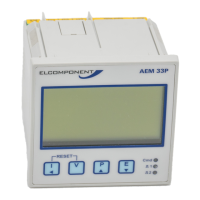
Selecting the Measurement Units:
Click on the drop-down list on the toolbar to select the desired unit.
The graphing engine uses a bar chart format for kWh, cost and carbon values,
and a line chart for amps, volts, kW & PF.
Dual trace graphs use the LH & RH Y axis to define the trace values.
USING THE GRAPHING PACKAGE