USING THE GRAPH TOOLS
Data View Options
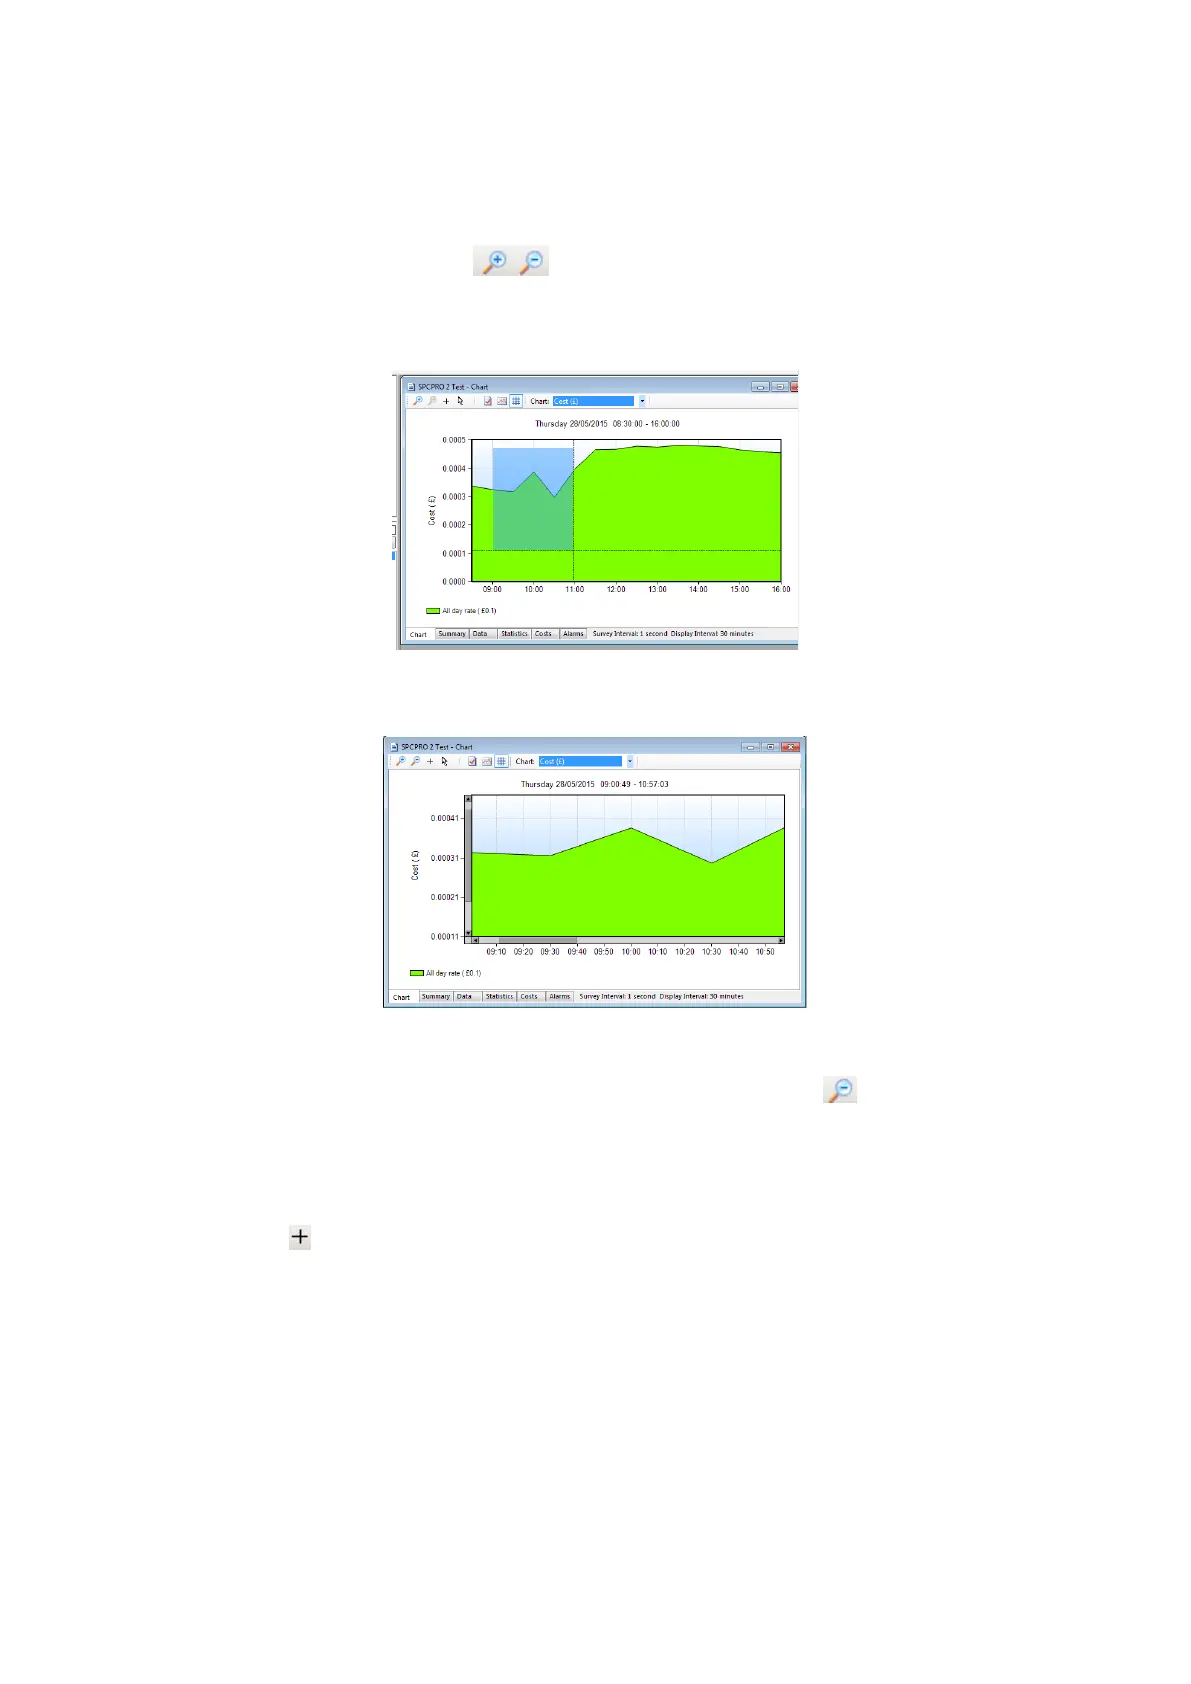
Zoom:
Click the zoom tool buttons to activate the zoom cursor. Drag the cursor
over the desired graph area whilst holding down the left mouse button to define
a zoom area.
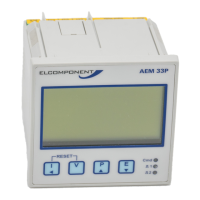
Release the mouse button to display the zoom area
NOTE: The zoom function can be repeated as many times as
necessary to provide a macro zoom capability. The button
reverses the zoom-in process by one step per click.
Show Data Values:
Click the crosshairs button to enable this feature. Place the crosshairs at any
point on the data trace to display the value and time stamp below the title bar.