Graph Operations
Graph – Print Data
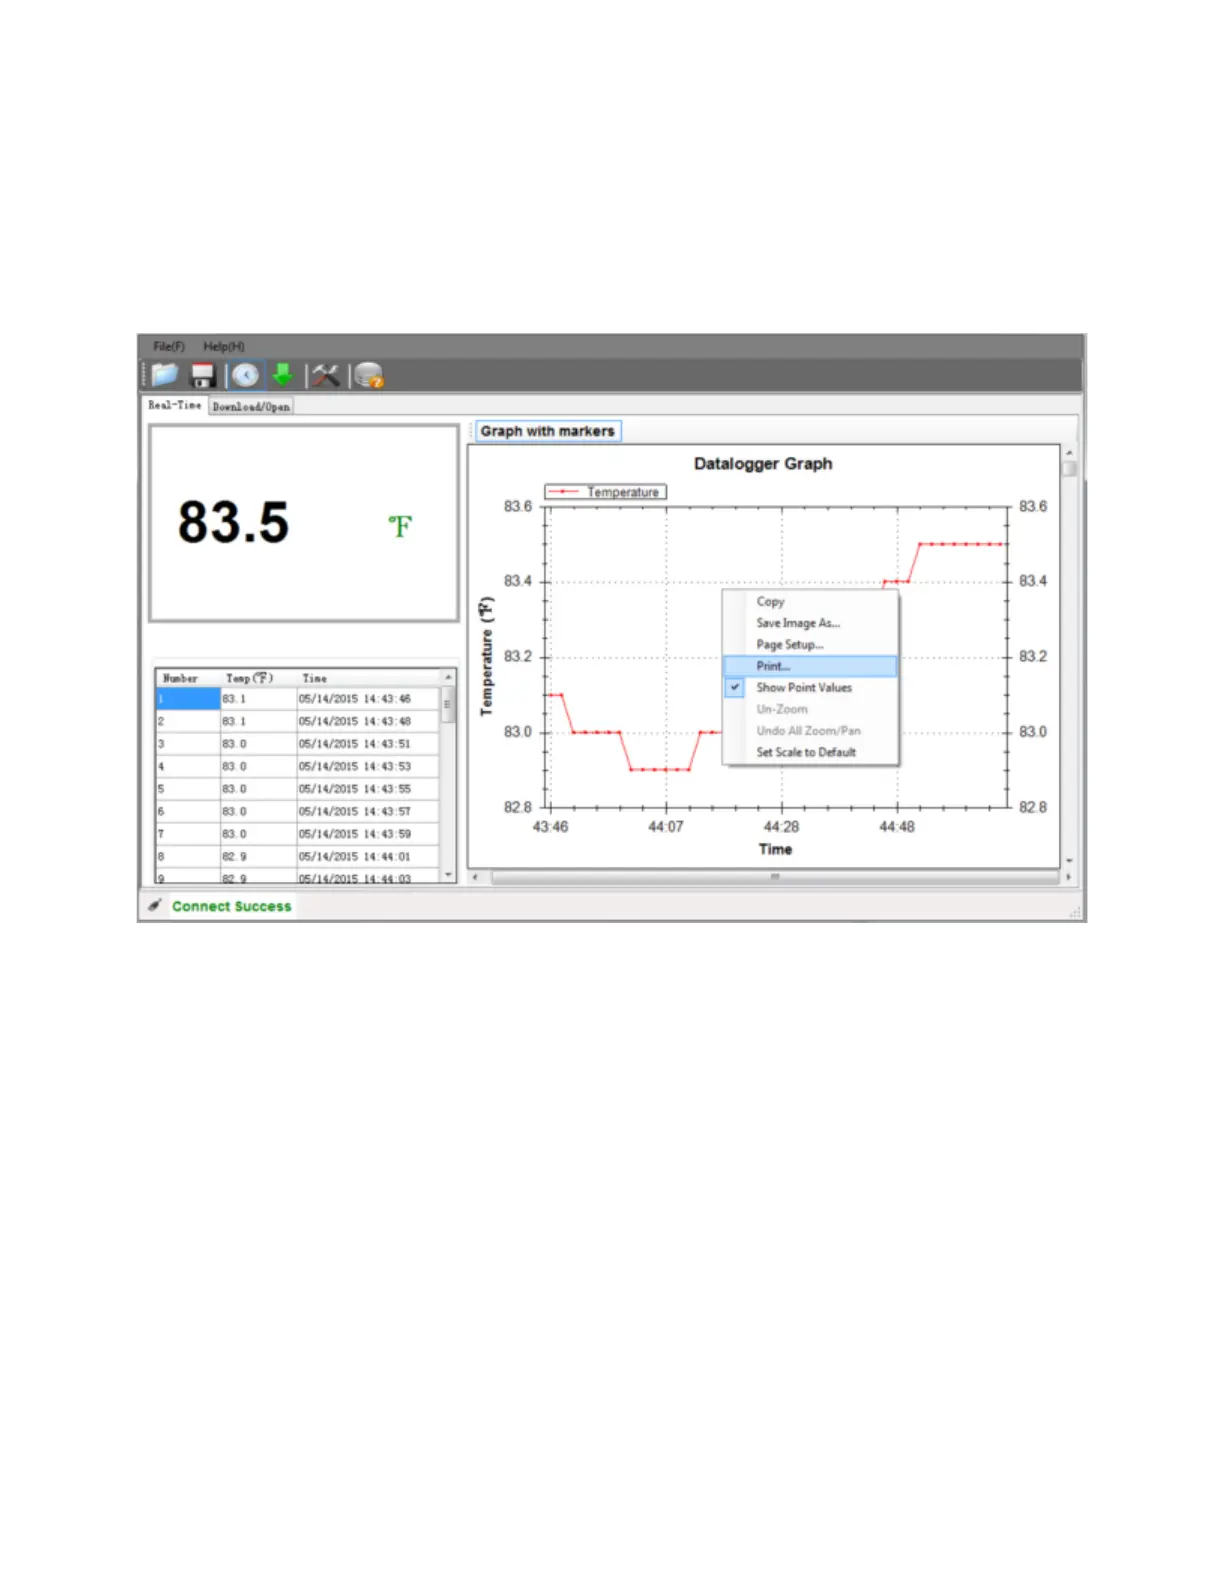
To print the saved Graph data, open a saved Graph data file (.IMTR) and Right-Click anywhere in the graphing window.
Select Print.
To print the saved logger data in a table format, Open the saved data file (.CSV) in Excel or other word processor and print
from that application.
Graph – Pan and Zoom
PAN – Left-click and hold the button, Move the mouse to move the image left and right and up and down.
ZOOM – Left click and release the graphed image.
Use the Mouse wheel to expand and contract the image.
Use the PAN feature to center the image in the area that you want to examine closer.
Undo Pan and Zoom – Right-click on the graphed image and choose Undo All Zoom/Pan or Set Scale to Default.
To highlight each measurement on the graph, right-click the graph and select Show Point Values.
Copyright © 2016 FLIR Systems, Inc.
All rights reserved including the right of reproduction in whole or in part in any form
ISO-9001 Certified
www.extech.com