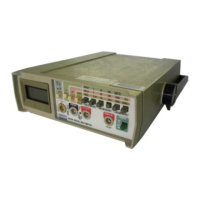
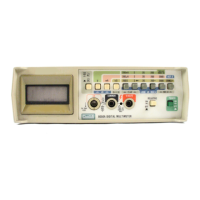
OPERATION
APPLICATIONS
2-61
.
TRANSISTOR
LEAKAGE TEST
2-62, Use
the following procedure
to test
transistors
for
leakage
(Ices):
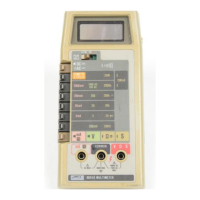
1. Install
the transistor,
and connect the
test
fixture to
the
Multimeter (see
preceding
paragraphs).
2. Set the switch
on
the test fixture to
ICES.
3.
Select the conductance function,
2 mS range on
the
Multimeter.
4. A
reading of
more than
0.0020
(6
juA) indicates
a faulty
transistor (silicon).
2-63. TRANSISTOR BETA TEST
2-64. Use
the following procedure to test the beta of
a
transistor:
1. Install the
transistor
and connect the
test
fixture to
the
Multimeter (see preceding
paragraphs).
2. Set the
switch
in the test
fixture to
BETA.
3.
Select
the conductance
function, 2
mS
range
on
the
Multimeter.
4. Note
the
display reading
on the Multimeter,
then
shift the decimal
point three places to the
right.
This
will be the
beta of the transistor.
NOTE
Beta is a
temperature-sensitive measurement.
Allow
sufficient
time
for
each tested transistor
to
stabilize.
Avoid touching
the transistor
case
with
your
fingers
while
making beta
measurements.
2-65.
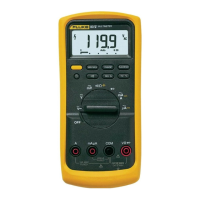
True-RMS
Measurements
2-66.
One of
the most useful features of the Multimeters
is the direct
measurement of true-rms ac voltages and ac
current.
Mathematically,
rms is defined as the square root
of
the mean of
the
squares of the instantaneous voltages.
In
physical terms, rms is
equivalent to the dc
value that
dissipates the
same amount of
heat
in a
resistor
as the
original
waveform.
True-rms is
the effective
value of any
waveform
and
represents
the energy level of the
signal.
It
is used
directly in the
relationships
of Ohm’s
Law
and
provides
a
reliable basis
for comparisons of dissimilar
waveforms.
2-67.
Most
multimeters in use today have average-
responding
ac
converters rather than
true-rms
converters
like the 8010A
and
80
12A. Usually the gain in average-
responding
meters is adjusted so
that
the reading gives
the
rms
value, provided
the
input signal
is
a harmonic-free
sinusoid.
However, if
the signal is not
sinusoidal, the
average-responding
meter
does
not give
a correct rms
reading.
2-68.
Y
our Multimeter’s ac converter calculates the
rms
value through analog computation. This results in
accurate
rms
values
for mixed
frequencies,
modulated
signals,
square waves,
sawtooths,
10%-duty-cycle
pulses,
etc, when
these
signals
are
measured with
your
Multimeter.
2-69.
Waveform Comparison (RMS vs
Averaging
Meters)
2-70.
Figure
2-14
shows
the
relationship
between
common
waveforms and their displayed value,
as they
appear on
the
80 10A or 8012A, compared to average-
responding
meters. Figure
2-14
also illustrates
the
relationship
between
ac and dc measurements for
ac-
coupled
meters. For example, the first waveform
(in
Figure
2-14)
is a sine wave with a peak voltage of 1.414V.
Both
Fluke Multimeters
(801 OA
and
8012A) and the
average
responding meters display the
correct
rms
reading
of l.OOOV (the dc component equals
0).
The
1.414V (peak) rectified square wave also produces a
correct dc reading
(0.707V)
on all the multimeters, but
only the
Fluke Multimeters
correctly measure the ac
component
(0.707V).
The average
responding
meter
measures
the ac component of the rectified
square waveas
0.785V, which is an error of
5.6%.
2-71. Waveform
Crest Factors
2-72.
The
crest factor of a
waveform
is
the
ratio of the
peak
to
rms
voltage. In
waveforms where
the
positive and
negative
half-cycles have different
peak voltages,
the
higher
voltage is used
in
computing
the
crest
factor. Crest
factors start at 1.0 for a square wave (peak voltage equals
rms
voltage).
2-73.
Your
Multimeter
can measure signals with a
crest
factor of 3.0 or
less,
at full scale. Figure
2-15
illustrates
some
typical
signals and their crest
factors. The
waveforms
in Figure
2-15
show that a signal
with a
crest
factor
of greater than 3.0 is not common.
2-74.
To ensure that a signal measured with
your
Multimeter has
a crest
factor
below
3.0,
measure the peak
value with an ac
coupled
oscilloscope. If the peak
value
is
not more than
three times
the true-rms reading
of
your
Multimeter,
then the crest
factor ofthe signal
is 3.0 or less.
Another method of verifying the
error caused
by the crest
factor of a signal is to compare the
reading
of your
Multimeter
with
a reading on the next higher
range of
your
Multimeter. The crest
factor capability
of your
Multimeter
increases
(from
3.0)
for readings less than
full-scale.
The crest factor capability
of
your
Multimeter
is
shown by the following equation:
Crest Factor
Capability
—
3
The error
caused
by
exceeding the crest factor of
3
.0
at full
scale,
will
be
reduced significantly on the next higher
measurement
range of your Multimeter. The crest factor
capability
at
1/10
scale
approaches 10.
2-13