28 01-28006-0072-20041105 Fortinet Inc.
Status System status
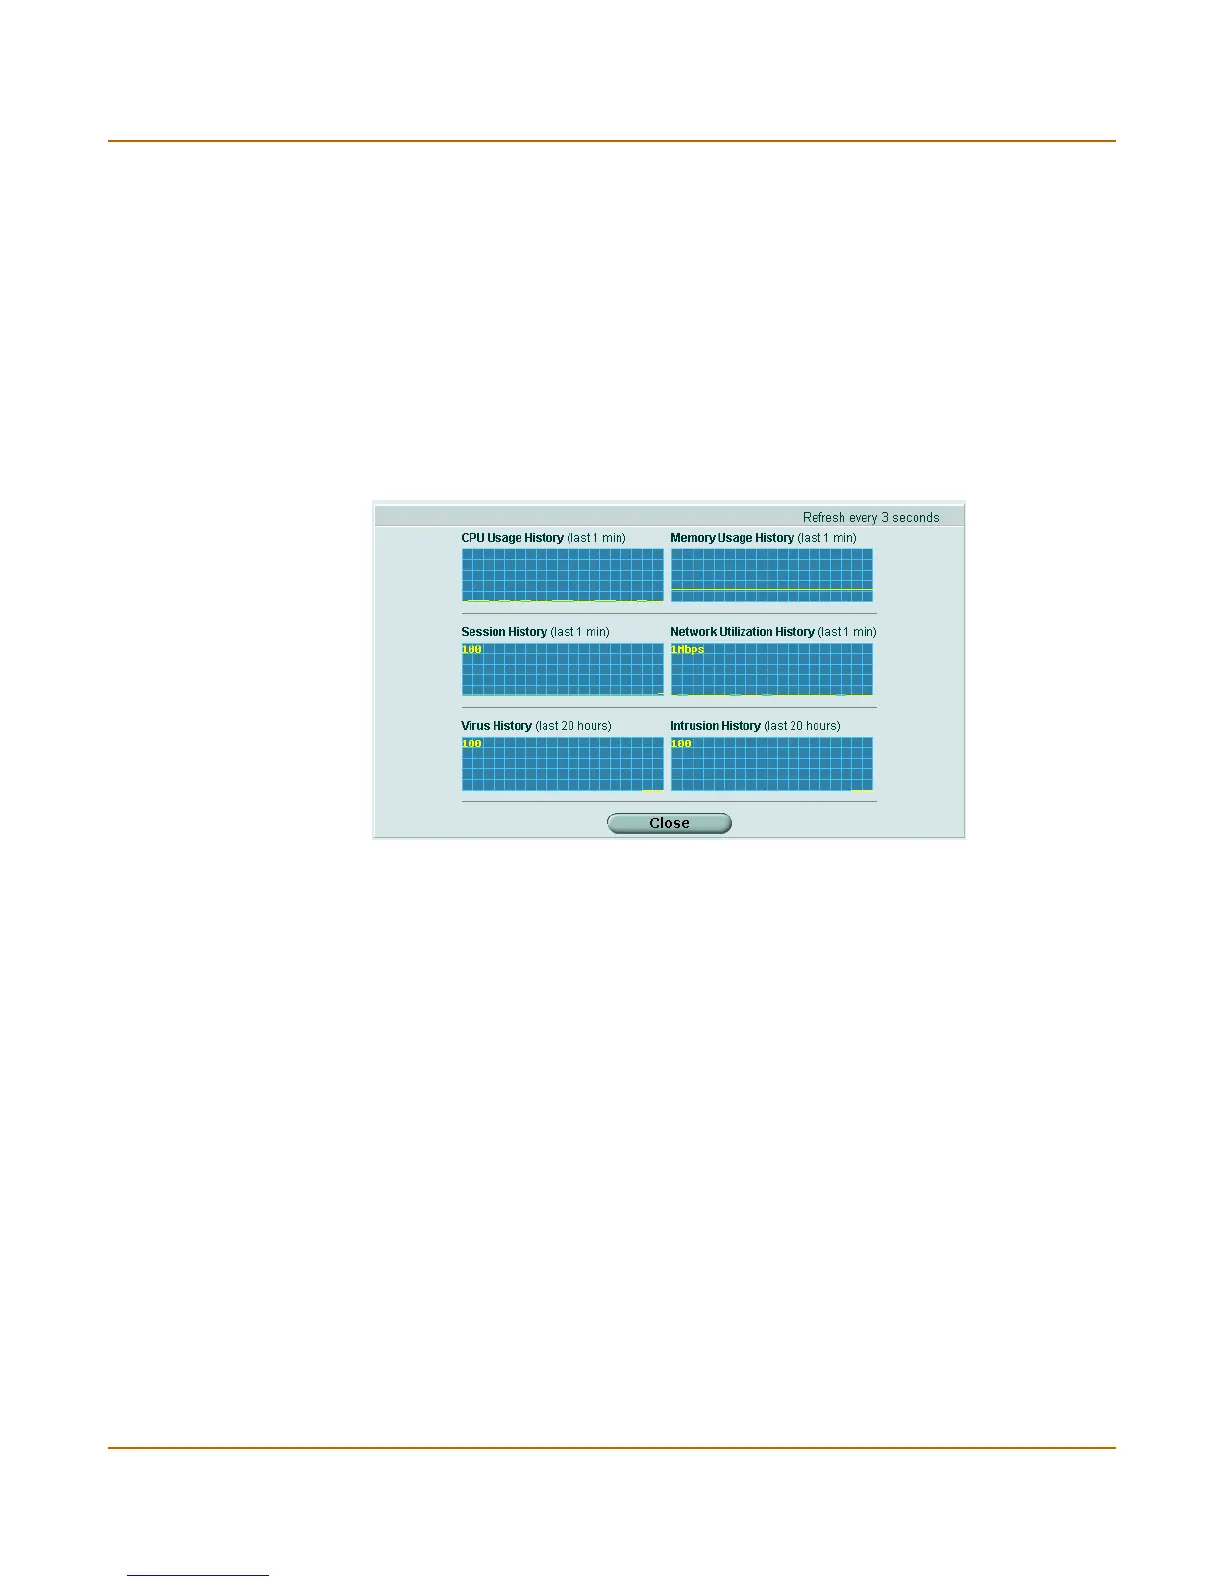
Figure 3: Sample system resources history
History
The history page displays 6 graphs representing the following system resources and
protection:
Recent Intrusion Detections
Hard Disk Usage The current hard disk (local disk) status. The web-based manager
displays hard disk usage for core processes only. CPU usage for
management processes (for example, for HTTPS connections to the
web-based manager) is excluded.
Active Sessions The number of communications sessions being processed by the
FortiGate unit.
Network Utilization The total network bandwidth being used through all FortiGate interfaces
and the percentage of the maximum network bandwidth that can be
processed by the FortiGate unit.
History Select History to view a graphical representation of the last minute of
CPU, memory, sessions, and network usage. This page also shows the
virus and intrusion detections over the last 20 hours.
CPU Usage History CPU usage for the previous minute.
Memory Usage History Memory usage for the previous minute.
Session History Session history for the previous minute.
Network Utilization
History
Network utilization for the previous minute.
Virus History The virus detection history over the last 20 hours.
Intrusion History The intrusion detection history over the last 20 hours.
Time The time at which the recent intrusion was detected.
Src / Dst The source and destination addresses of the attack.
Service The service from which the attack was delivered; HTTP, FTP, IMAP,
POP3, or SMTP.
Attack Name The name of the attack.
 Loading...