Real-Ear Measurements 95
5.5.1 Viewing the AI display
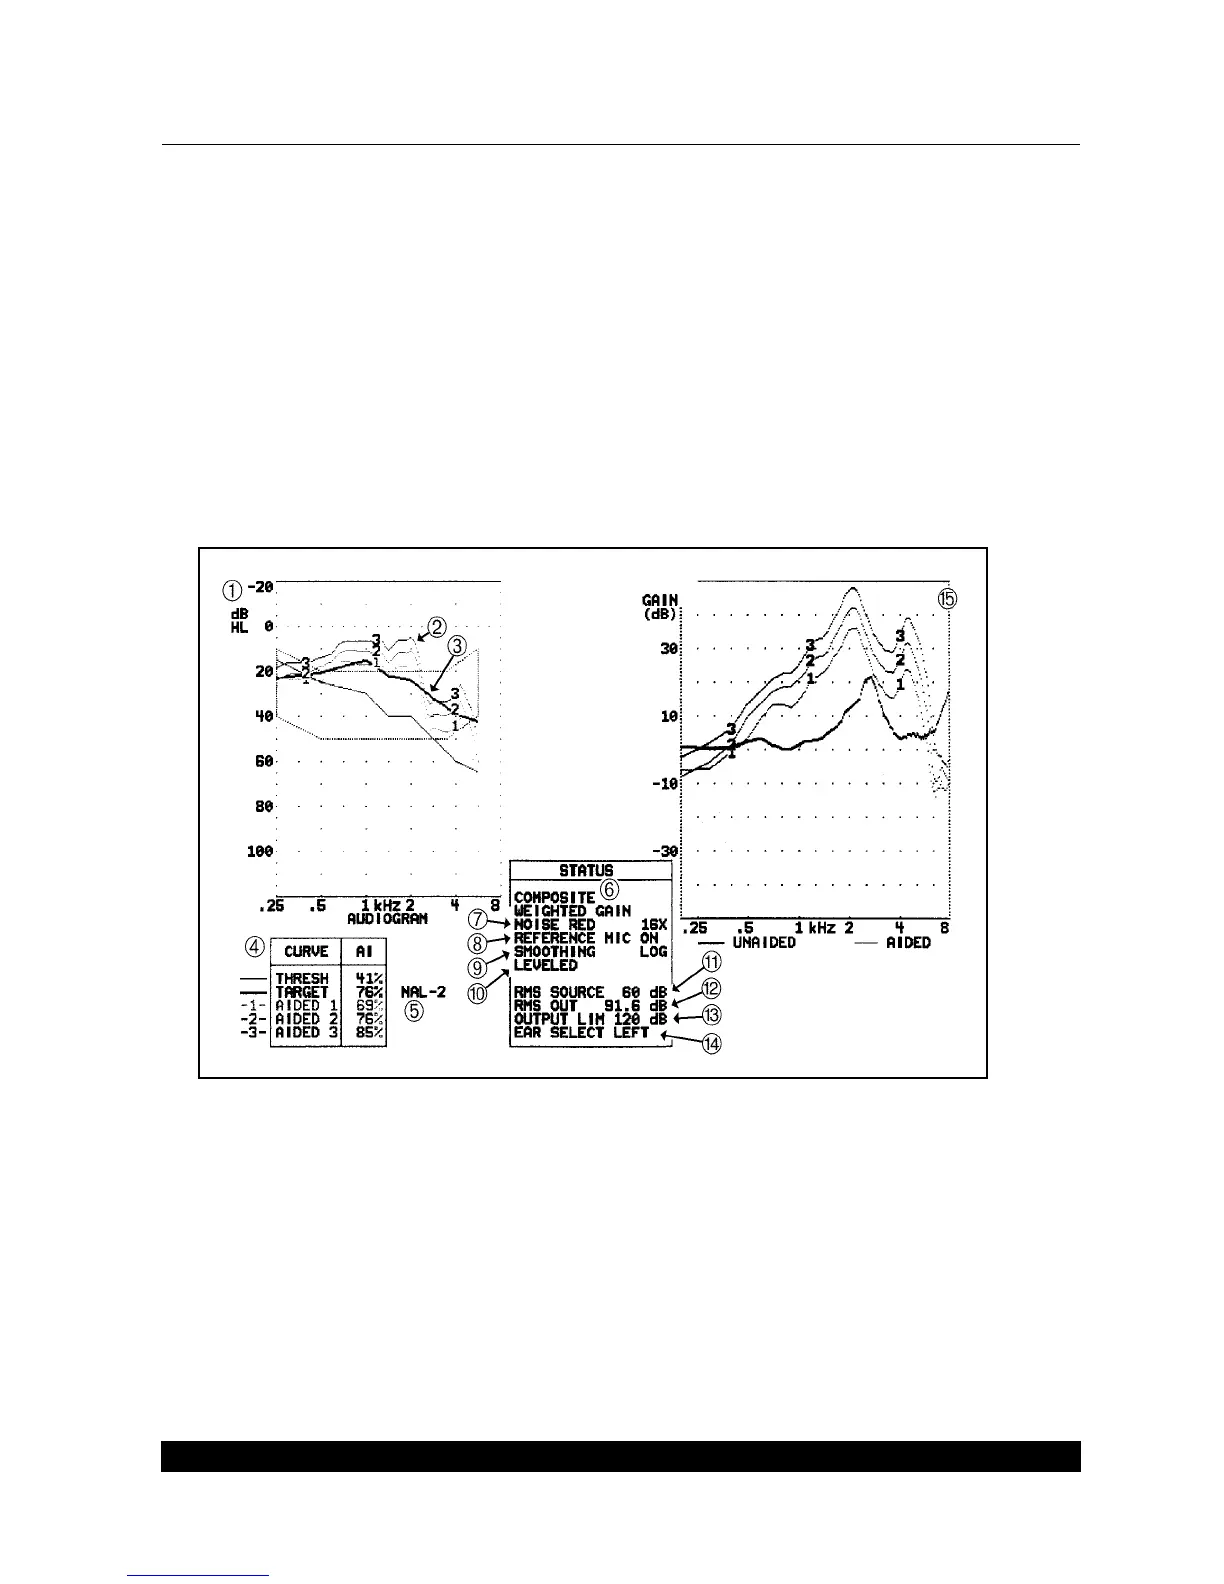
See Figure 5.5.1 for a picture of the Audibility Index display.
1. dB HL graph for unaided and aided audiogram responses
2. Aided audiogram responses (from insertion gain measurements)
3. Insertion gain target displayed in dB HL
4. Table containing expected percentage of audibility of speech
5. Selected fitting rule
6. Source type for current curve
7. Noise reduction status for current curve
Figure 5.5.1—External video display of the Audibility Index
8. Reference microphone status
9. Smoothing status
10. Leveling status
11. RMS source level used to take measurement
12. RMS of the current curve. Not available with pure-tone source types.