1. OPERATION
1-11
TEMP
DEPTH
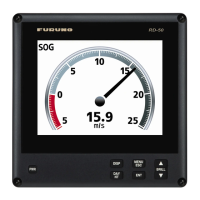
SOG
STW
WIND
CURRENT
PRESSURE
Graph display options window
3. Choose the graph display option desired and then press the [ENT] key. One
of the following graph display setup menus appears depending on your
selection.
GRAPH
BASE POINT : + 50
°
F
RANGE : 10
°
F
PERIOD : 5MIN
< TEMP GRAPH SETUP >
Temperature graph setup menu
GRAPH
START FROM: + 0FT
MAX. RANGE : 300FT
PERIOD : 5MIN
< DEPTH GRAPH SETUP >
Depth graph setup menu
GRAPH
START FROM: + 0KT
MAX. RANGE : 30KT
PERIOD : 5MIN
< SOG GRAPH SETUP >
Speed-over-ground graph setup menu
GRAPH
START FROM: + 0KT
MAX. RANGE : 30KT
PERIOD : 5MIN
< STW GRAPH SETUP >
Speed-through-water graph setup menu
GRAPH
START FROM: + 0KT
MAX. RANGE : 20KT
PERIOD : 5MIN
< WIND GRAPH SETUP >
Wind graph setup menu
GRAPH
START FROM: + 0KT
MAX. RANGE : 10KT
PERIOD : 5MIN
CURRENT GRAPH SETUP
Current graph setup menu
GRAPH
START FROM: + 0800 hPa
MAX. RANGE : 1200 hPa
PERIOD : 5MIN
< PRESSURE GRAPH SETUP >
Atmospheric pressure graph setup menu
Graph display setup menus
Note: The setting of PERIOD of each graph setup is linked, that is, it can not
be set individually for each graph setup.
 Loading...