38 Owner’s Manual for Power Zone Connectivity Server
Installation and Operation
Trending
Power Zone has three ways to collect and analyze a
series of values collected over a period of time: Remote
Trending, Local Trending and Data Logging.
Remote Trending
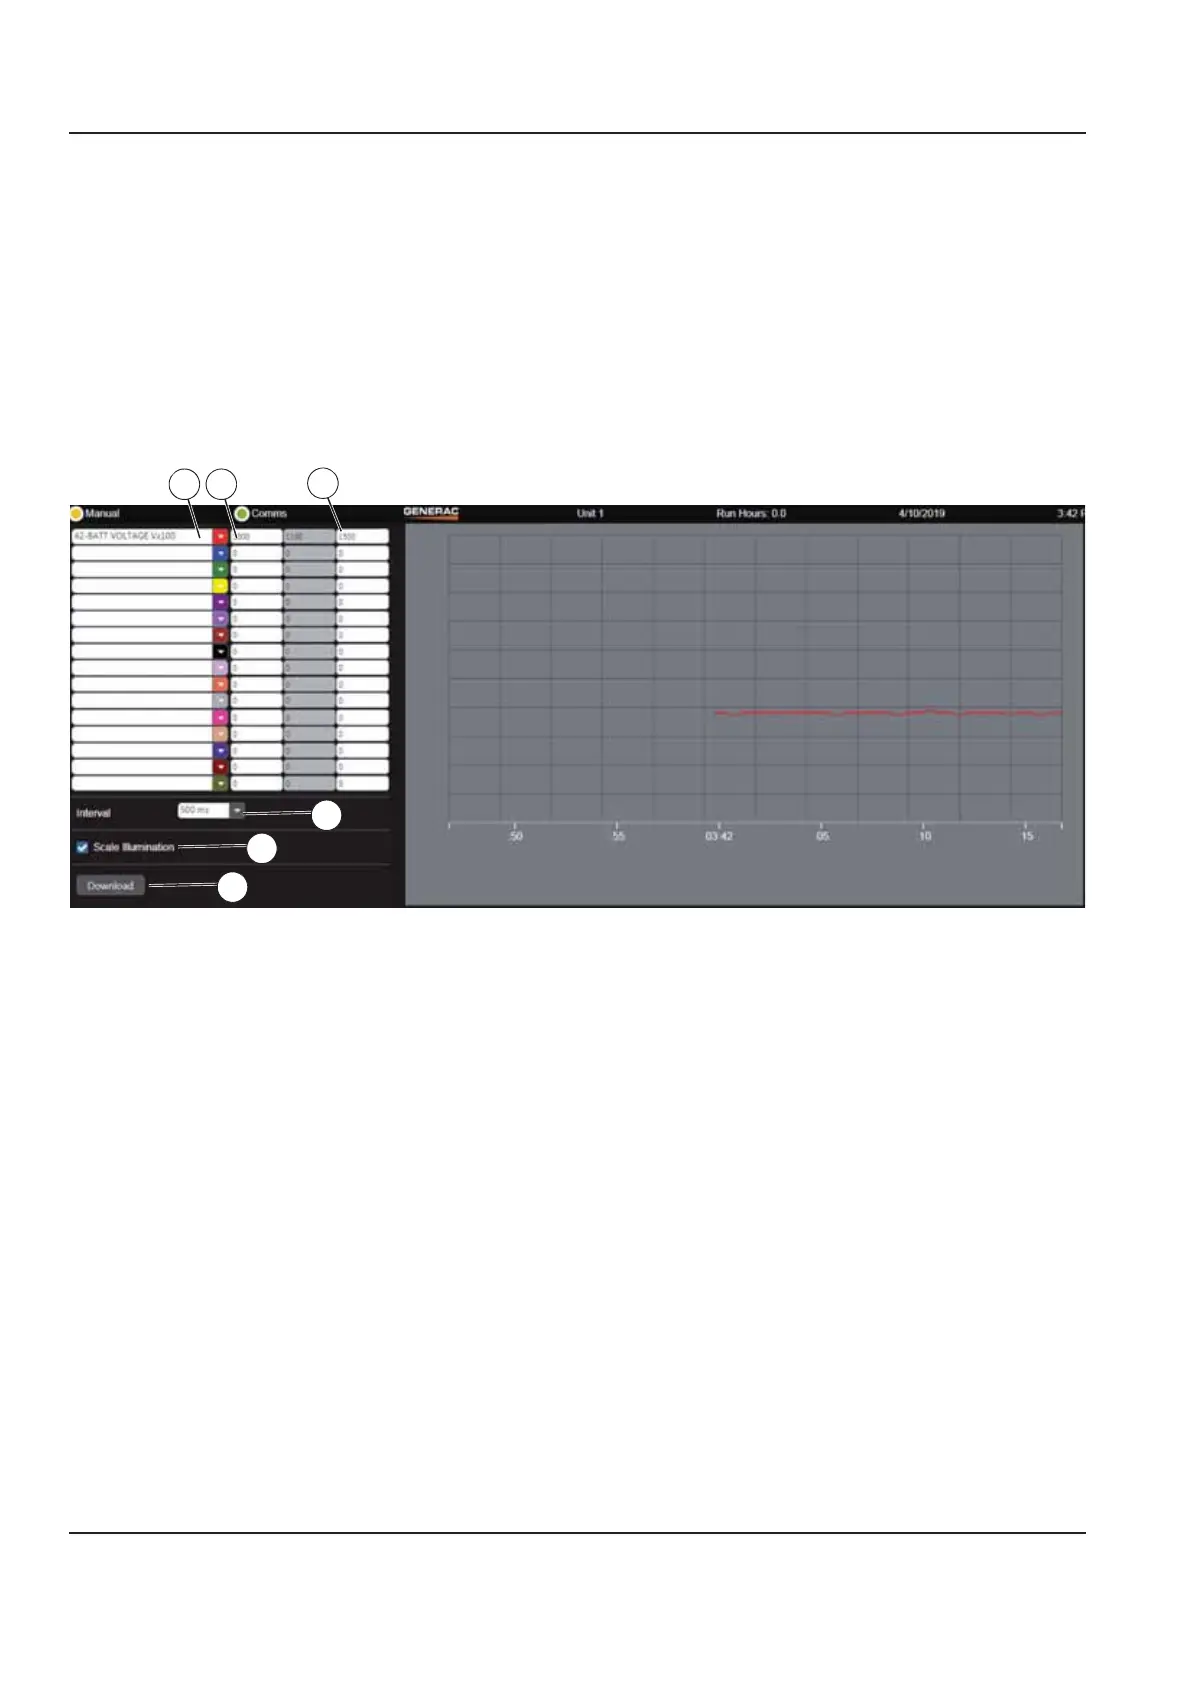
See Figure 3-90. Remote Trending displays data in a
graph as it is collected. Up to 16 values can be graphed
at the same time. The values to be graphed are selected
using the drop down lists on the left (A). The color of the
drop down arrow indicates the color line that will be used
to draw the graph. The minimum value to graph is
entered into the text box next to the drop down list (B).
The text box on the far right is used to enter the
maximum value to graph (C). The current value being
read is displayed in the middle text box. The time interval
between readings is selected using the Interval drop
down list (D). The fastest data collection rate supported
by Remote Trending is 250 ms. The grid lines behind the
graph can be turned on or off using the Scale Illumination
checkbox (E). To download a comma separated value file
containing the collected data, press the Download button
(F). A file named “TrendingLog.csv” will be downloaded
to the Downloads folder on your PC.
Figure 3-90. Remote Trending Screen
 Loading...