this window. Click the right key of mouse to call up a menu without multiply selection. When
the end position of QRS wave is adjusted, 3-D frequency graph will also change.
3-D frequency graph: display 3-D frequency graph of the single-lead superposed wave.
Click
to print and click to preview the VLP analyze report in VLP analytical module.
TVCG analysis module
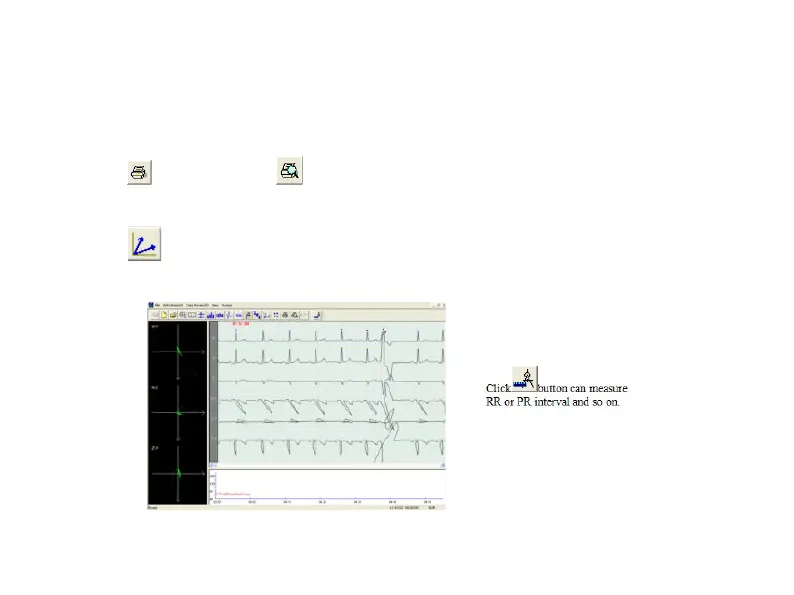
Click
button and enter TVCG analysis module.
Click R point by mouse, VCG graph will display at the left of the screen.