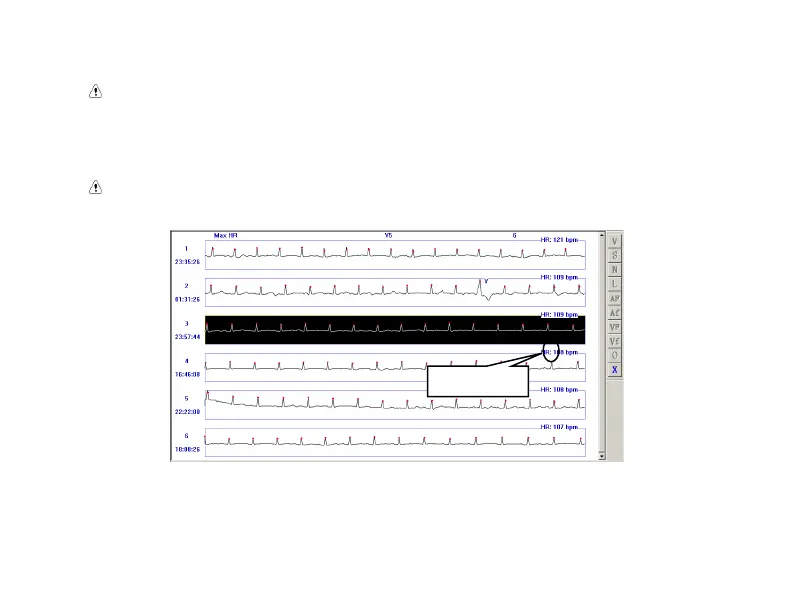
Notice: for Max HR, default 6 strip graphs are displayed. If all of that 6 graphs are
interference waves or false error, select a graph and delete it. Then the software will
automatically analyze and get a new Max HR strip graph and add to the display, as
Fig.6-14.
Notice: it is similar between Min HR and Max HR in display and operation, so there
will be no extra introduction in the following content.
Fig.6-14