for “STE”(ST elevation) and “STD”(ST depression) analysis functions. Physician can
modify the parameters and then repeat the ST segment analysis to this lead.
The software has myocardial ischemia analysis function, which can analyze the ST
depression events, display the ST depression fragments of all leads in the myocardial
ischemia data table (Figure 6-23), and provide a print report.
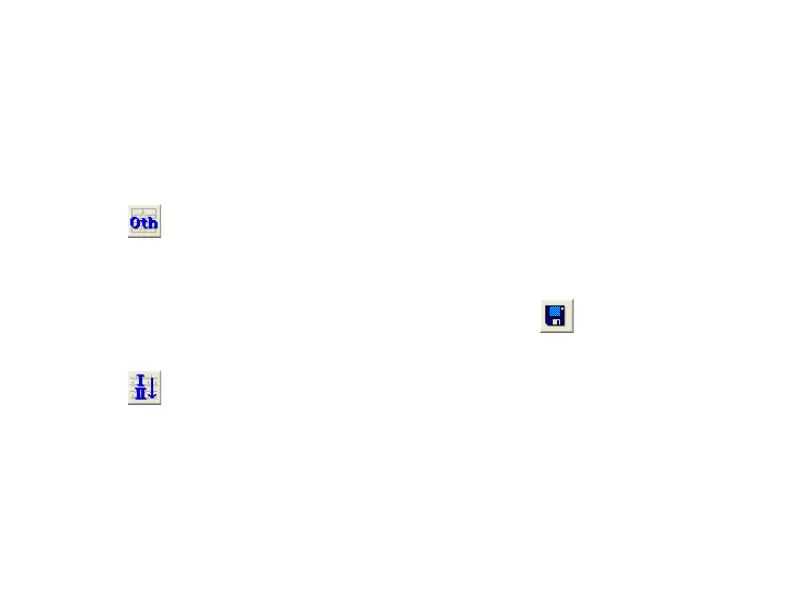
Click
button, display other classified strip graph: S Couplet, S Bigeminal rhythm, S
Trigeminal rhythm, S Run; V Run, V Couplet, V Bigeminal rhythm, V Trigeminal rhythm, R-R
Pause, Atrial flutter, Atrial fibrillation, V Flutter, V Fibrillation, Max HR, Min HR, Bradycardia.
Before above the classified ECG display operations, if refresh button
(high bright) means
the data need refresh, click this button to refresh data.
Click
button to display single lead ECG waveform or change the lead displayed in the
strip graph.