judged condition, the third QRS wave after this position is ventricular premature beat, you can
see the RR interval trend graph in the whole HRT occurring term in the left below graph, which
have signed the TO, TS segment with red line to make the user more convenient to judge.
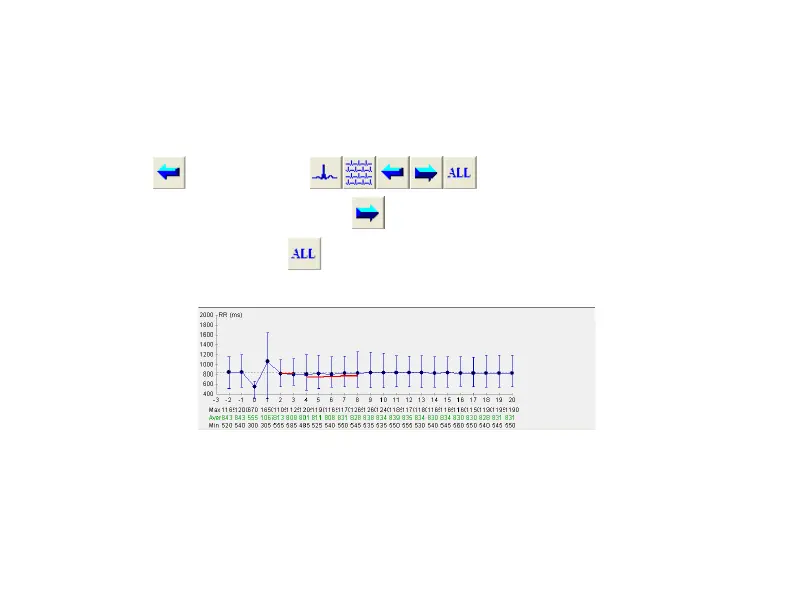
Click the
button in toolbar will display the wave that satisfies
last HRT analysis condition, Click the
button will display the wave that satisfies next
HRT analysis condition, click
will display the HRT waveform after superposition on the
left below window graph as Fig.6-27.
Fig.6-27
The erect line on the dot express RR interval the maximal value and minimal value on different
period of time.