23
11. Pump settings and pump performance
Contents:
11.1 Relation between pump setting and pump performance.
11.1 Relation between pump setting and pump performance
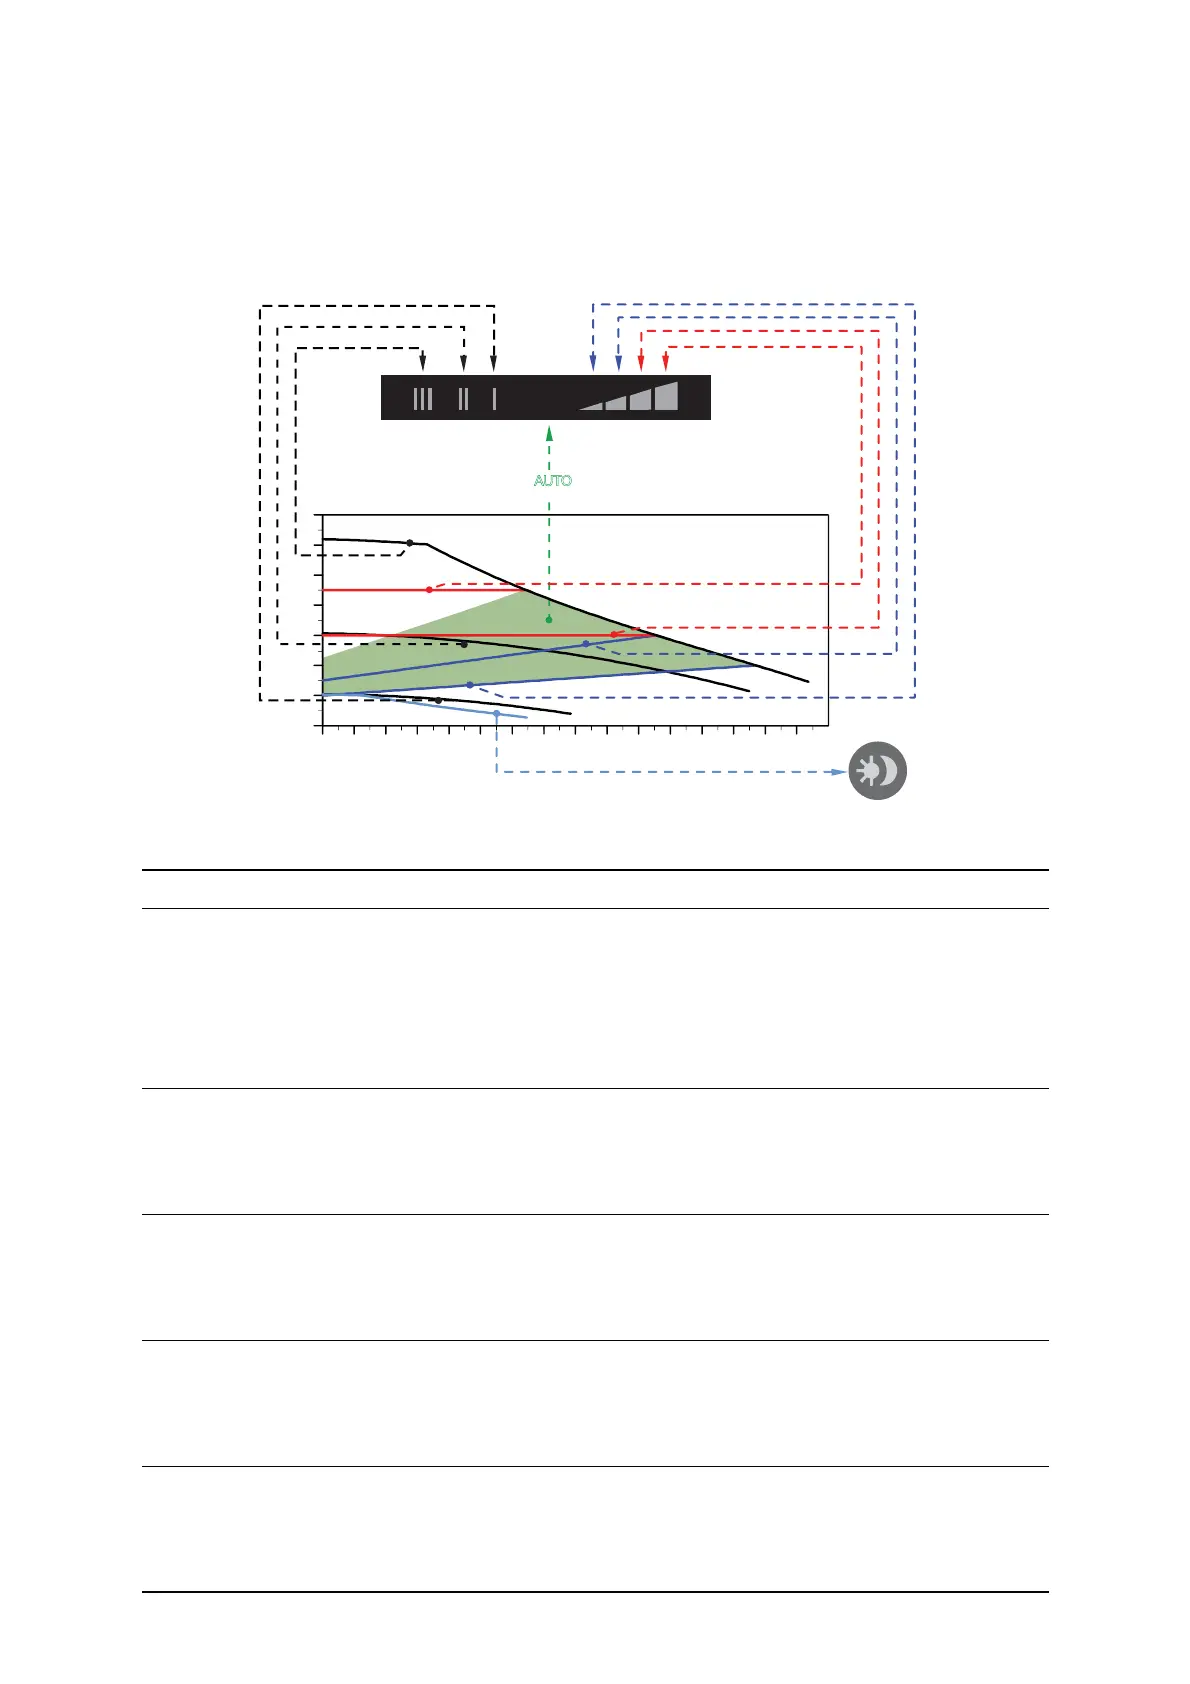
Figure 14 shows the relation between pump setting and pump
performance by means of curves. See also 14. Performance curves.
Fig. 14 Pump setting in relation to pump performance
TM03 9208 3607
III
II
I
AUTO
ADAPT
AUTO
ADAPT
PP1
PP2
CP1
CP2
H
Q
Setting Pump curve Function
AUTO
ADAPT
(factory
setting)
Highest to
lowest
proportional-
pressure curve
The AUTO
ADAPT function enables ALPHA2 to control the pump
performance automatically within a defined performance range,
see fig. 14:
• Adjusting the pump performance to the size of the system.
• Adjusting the pump performance to the variations in load over
time.
In AUTO
ADAPT, the pump is set to proportional-pressure control.
PP1
Lowest
proportional-
pressure curve
The duty point of the pump will move up or down on the lowest
proportional-pressure curve, see fig. 14, depending on the water
demand.
The head (pressure) is reduced at falling water demand and
increased at rising water demand.
PP2
Highest
proportional-
pressure curve
The duty point of the pump will move up or down on the highest
proportional-pressure curve, see fig. 14, depending on the water
demand.
The head (pressure) is reduced at falling water demand and
increased at rising water demand.
CP1
Lowest
constant-
pressure curve
The duty point of the pump will move out or in on the lowest
constant-pressure curve, see fig. 14, depending on the water
demand in the system.
The head (pressure) is kept constant, irrespective of the water
demand.
CP2
Highest
constant-
pressure curve
The duty point of the pump will move out or in on the highest
constant-pressure curve, see fig.14, depending on the water
demand in the system.
The head (pressure) is kept constant, irrespective of the water
demand.