37
[<c01d54a8>] hub_thread+0x88c/0xa64
[<c006ce28>] kthread+0xfc/0x12c
[<c00588d0>] do_exit+0x0/0x818
[<ffffffff>] 0xffffffff
[Sysname-probe]
4. Use the display diagnostic-information command to collect diagnostic information.
5. Save the information displayed in the previous steps.
6. Contact H3C Support.
High memory utilization
Symptom
The display memory command shows that the memory utilization of the device is higher than 60%
during a period of time (typically 30 minutes).
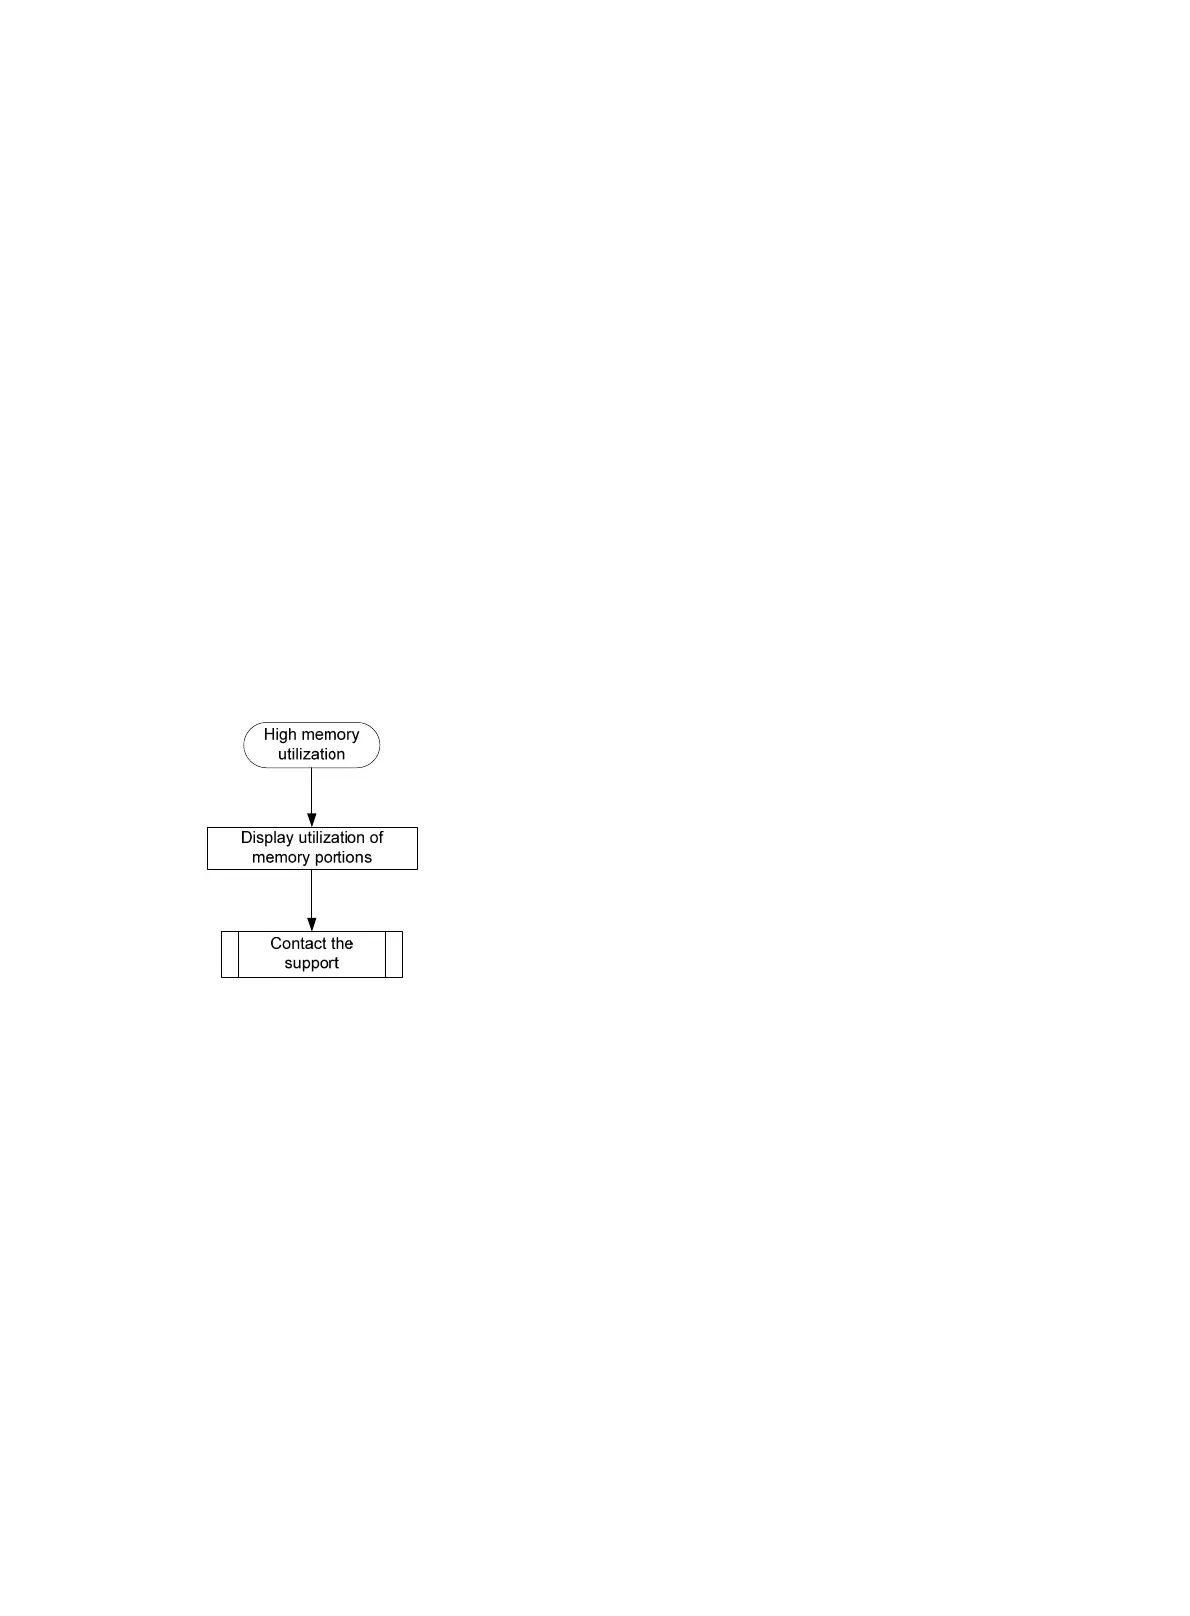
Troubleshooting flowchart
Figure 19 Troubleshooting high memory utilization
Solution
To resolve the issue:
1. Execute the display system internal kernel memory pool command multiple times
to identify the memory portions that show an unexceptionally utilization increase.
<Sysname> system-view
[Sysname] probe
[Sysname-probe] display system internal kernel memory pool slot 1
Active Number Size Align Slab Pg/Slab ASlabs NSlabs Name
0 0 80 0 32 1 0 0 ARP_MFFACL_Cachep
0 0 120 0 24 1 0 0 LFIB_IlmEntryCache2
0 0 216 0 15 1 0 0 mfib_source_route_cache
28 28 524240 0 1 128 28 28 kmalloc-524240
2 12 256 0 12 1 1 1 sgpool-16
48 51 32 0 51 1 1 1 SYNC_Chn_Object
0 0 64 0 36 1 0 0 LFIB_FTNSTAT_MplsBasCache
 Loading...