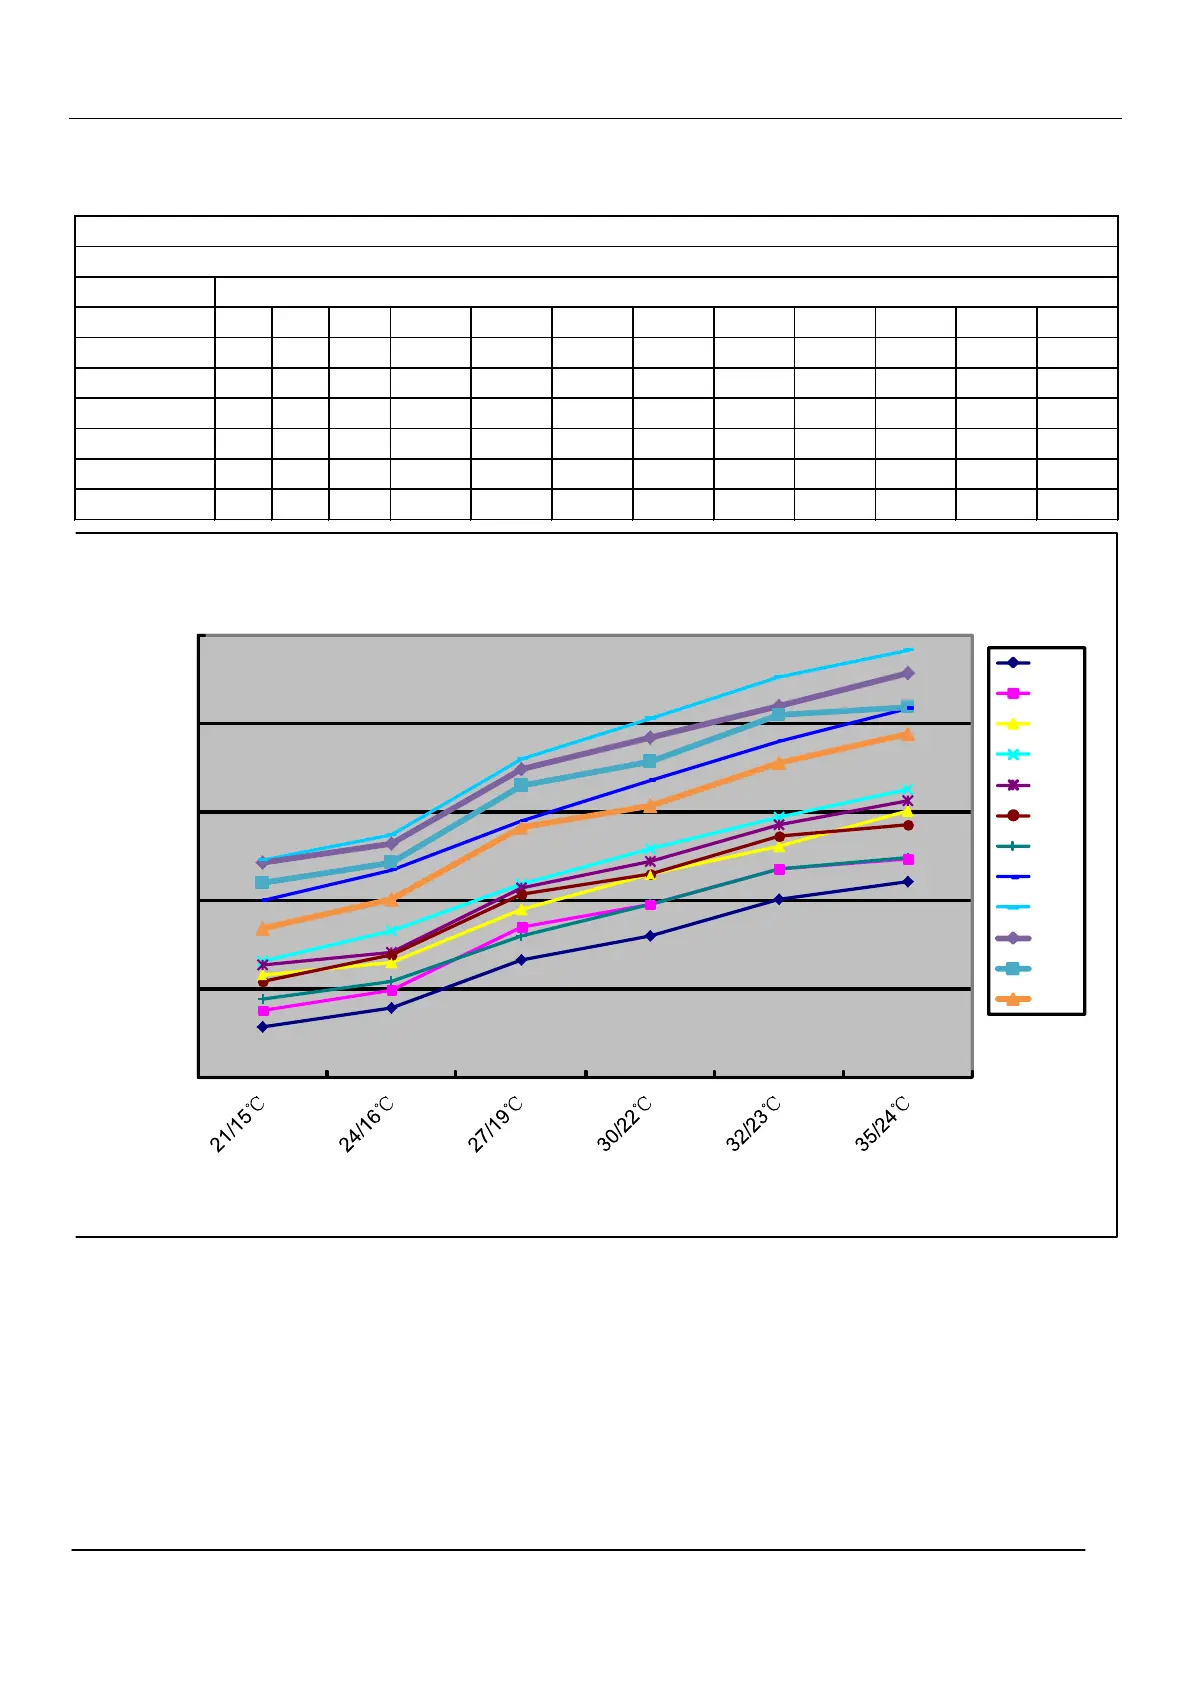
Performance and ceves diagrams
11.1 Cooling capacity-temperature curves
performance curves
cooling value-temeratur
e table
indoor temp.
DB/WB -20℃ -10℃ 0℃ 8℃ 15℃ 20℃ 25℃ 30℃ 35℃ 38℃ 40℃ 43℃
21/15℃ 2285 2372 2573 2652 2633 2536 2439 2993 3225 3207 3096 2842
24/16℃ 2387 2487 2643 2823 2703 2690 2539 3165 3365 3318 3210 3005
27/19℃ 2657 2850 2947 3088 3069 3031 2799 3443 3793 3742 3645 3412
30/22℃ 2800 2975 3150 3290 3220 3150 2975 3675 4025 3920 3780 3535
32/23℃ 3005 3175 3305 3471 3427 3359 3175 3895 4258 4100 4049 3776
35/24℃ 3100 3229 3506 3623 3564 3429 3242 4080 4407 4284 4091 3939
cooling capacity and indoor/outdoor temp.curves
4500
4000
3500
3000
2500
2000
indoor temp.(DB/WB)
46 Domestic air conditioner
-20℃
-10℃
0℃
8℃
15℃
20℃
25℃
30℃
35℃
38℃
40℃
43℃
cooling capacity (W)
 Loading...