Performance and ceves diagrams
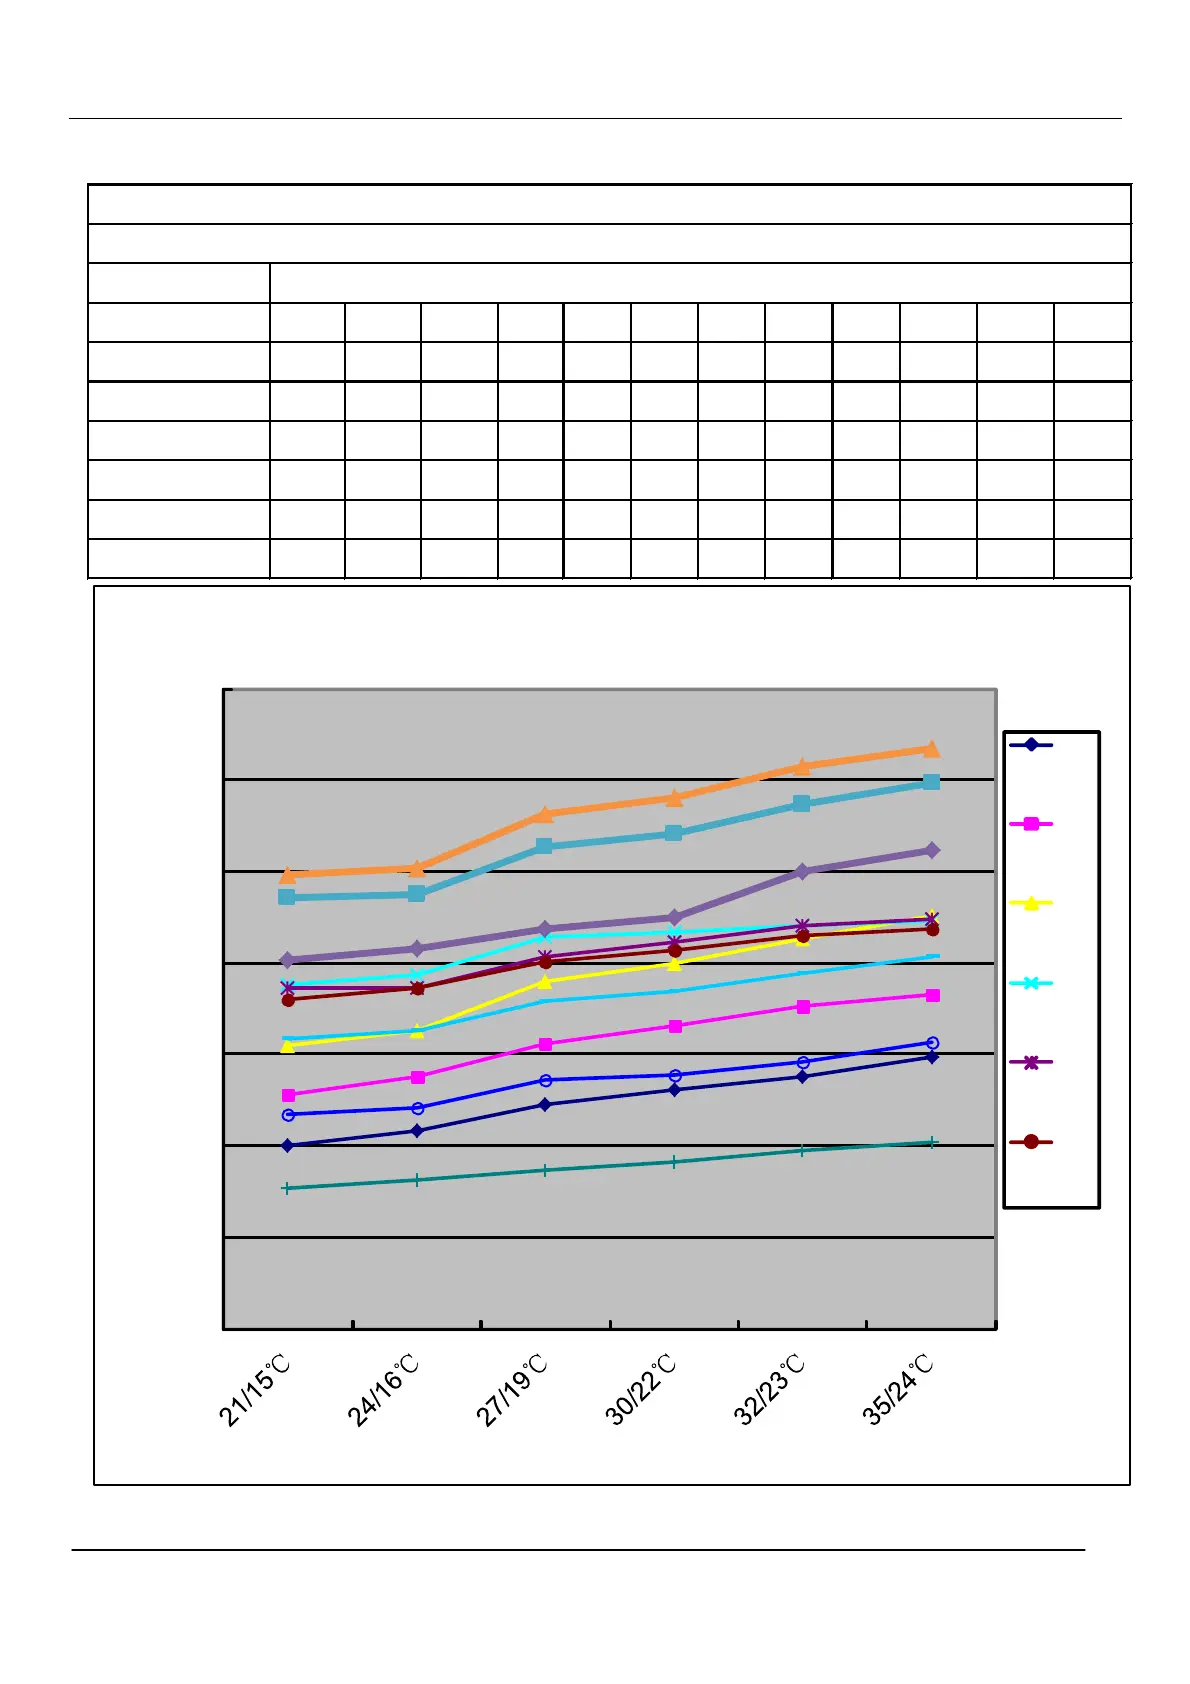
11.2 Cooling power consumption value- temperature curves
performance curves
power consumption value-temp.table
indoor temp.
DB/WB -20℃ -10℃ 0℃ 8℃ 15℃ 20℃ 25℃ 30℃ 35℃ 38℃ 40℃ 43℃
21/15℃ 502 613 720 852 846 819 407 570 733 905 1044 1094
24/16℃ 533 650 753 873 843 846 423 582 751 930 1049 1105
27/19℃ 590 722 858 957 914 904 446 643 818 974 1154 1225
30/22℃ 622 763 900 968 947 926 465 656 839 1000 1181 1263
32/23℃ 652 804 954 981 983 960 488 685 877 1101 1247 1328
35/24℃ 693 831 1004 992 994 976 508 728 913 1146 1295 1371
power consumption and temp.curves
1500
-
1300
20
10
1100
0℃
900
8℃
700
15
℃
500
20
℃
300
100
indoor temp.(DB/WB)
48 Domestic air conditioner
power consumption(w)
℃
-
℃
 Loading...