Performance and ceves diagrams
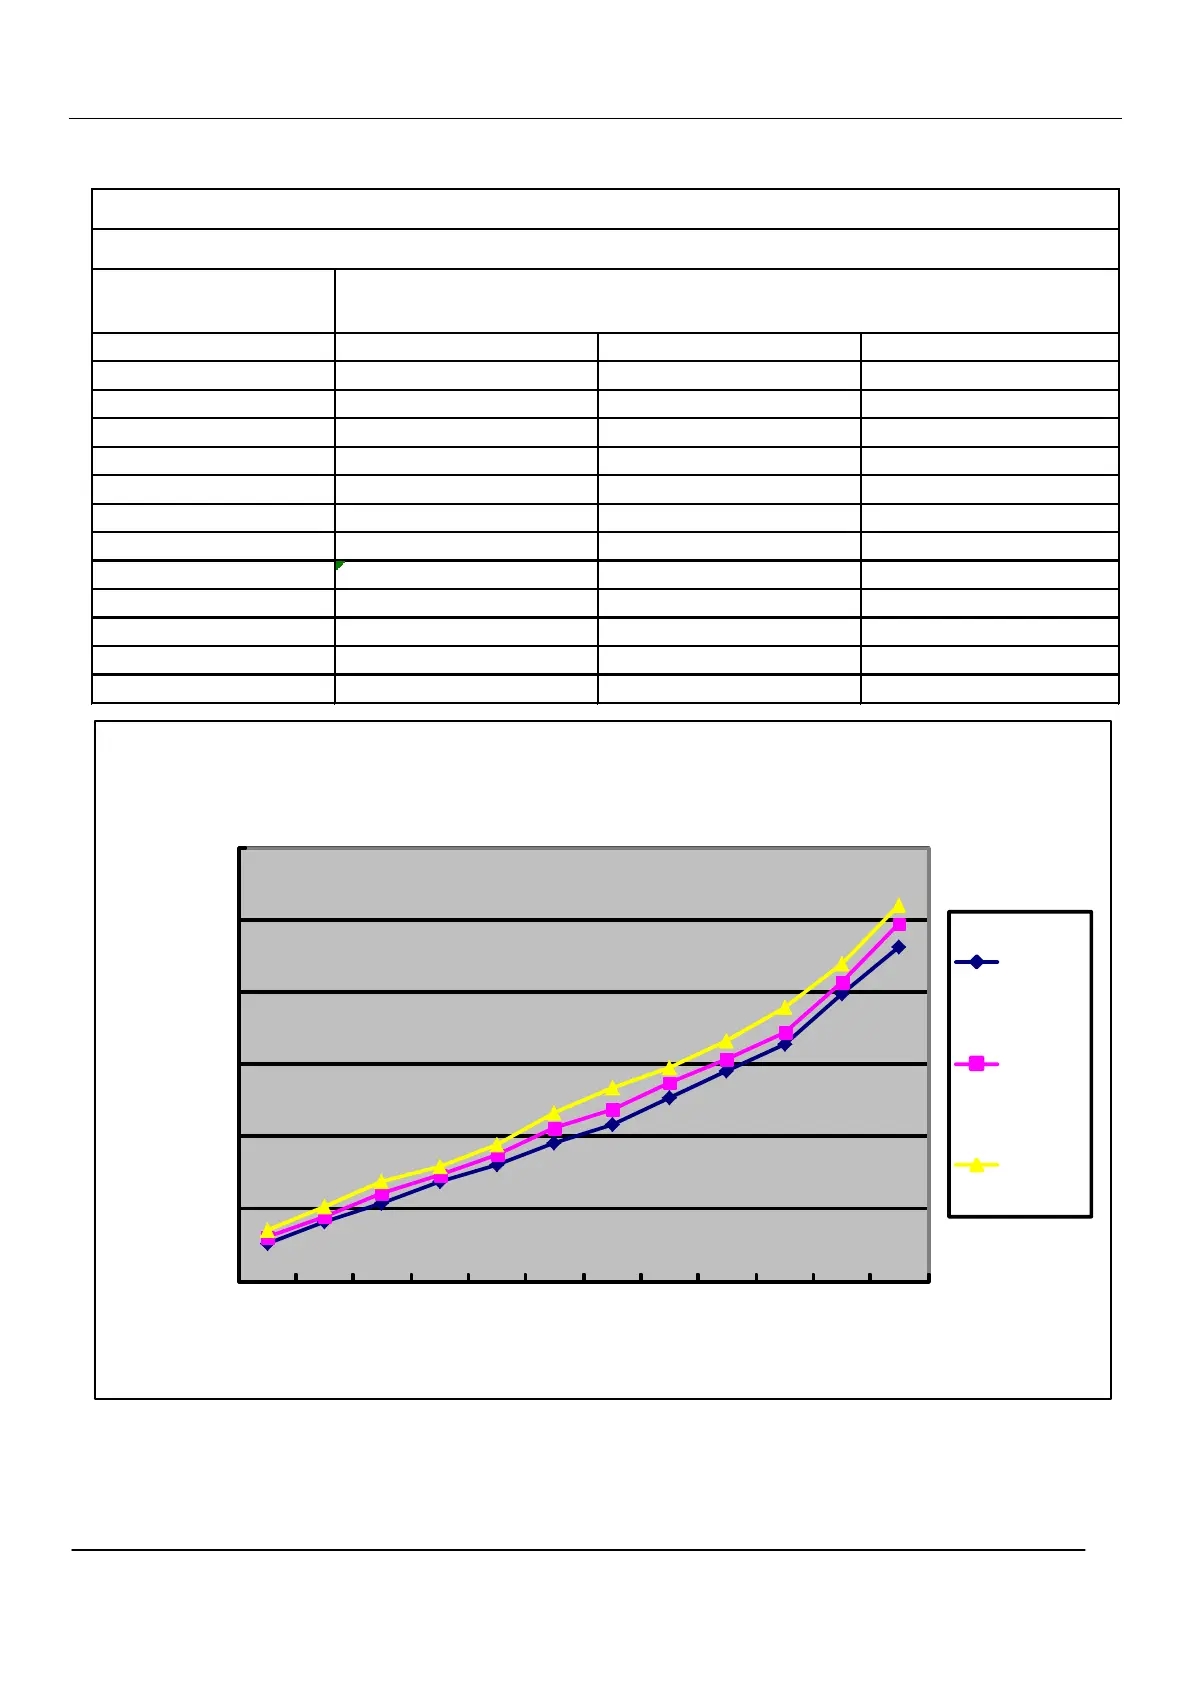
11.3 Cooling discharge pressure curves
performance curves
cooling discharge pressure.table
outdoor temp.
(humidity 46%)
indoor temp.
DB/WB 21/15℃ 27/19℃ 35/24℃
-20℃ 1259 1309 1358
-10℃ 1406 1443 1519
0℃ 1538 1603 1684
8℃ 1694 1737 1796
15℃ 1803 1870 1941
20℃ 1953 2057 2165
25℃ 2084 2191 2332
30℃ 2271 2378 2476
35℃ 2458 2538 2657
38℃ 2640 2725 2894
40℃ 2990 3073 3201
43℃ 3314 3474 3599
cooling discharge pressure and temp. curves
4000
3500
21/15℃
3000
2500
27/19℃
2000
35/24℃
1500
1000
- -
0℃ 8℃ 15℃ 20℃ 25℃ 30℃ 35℃ 38℃ 40℃ 43℃
20℃ 10℃
outdoor temp.(DB/WB)
50 Domestic air conditioner
discharge pressure (Kpa)
 Loading...