Performance and ceves diagrams
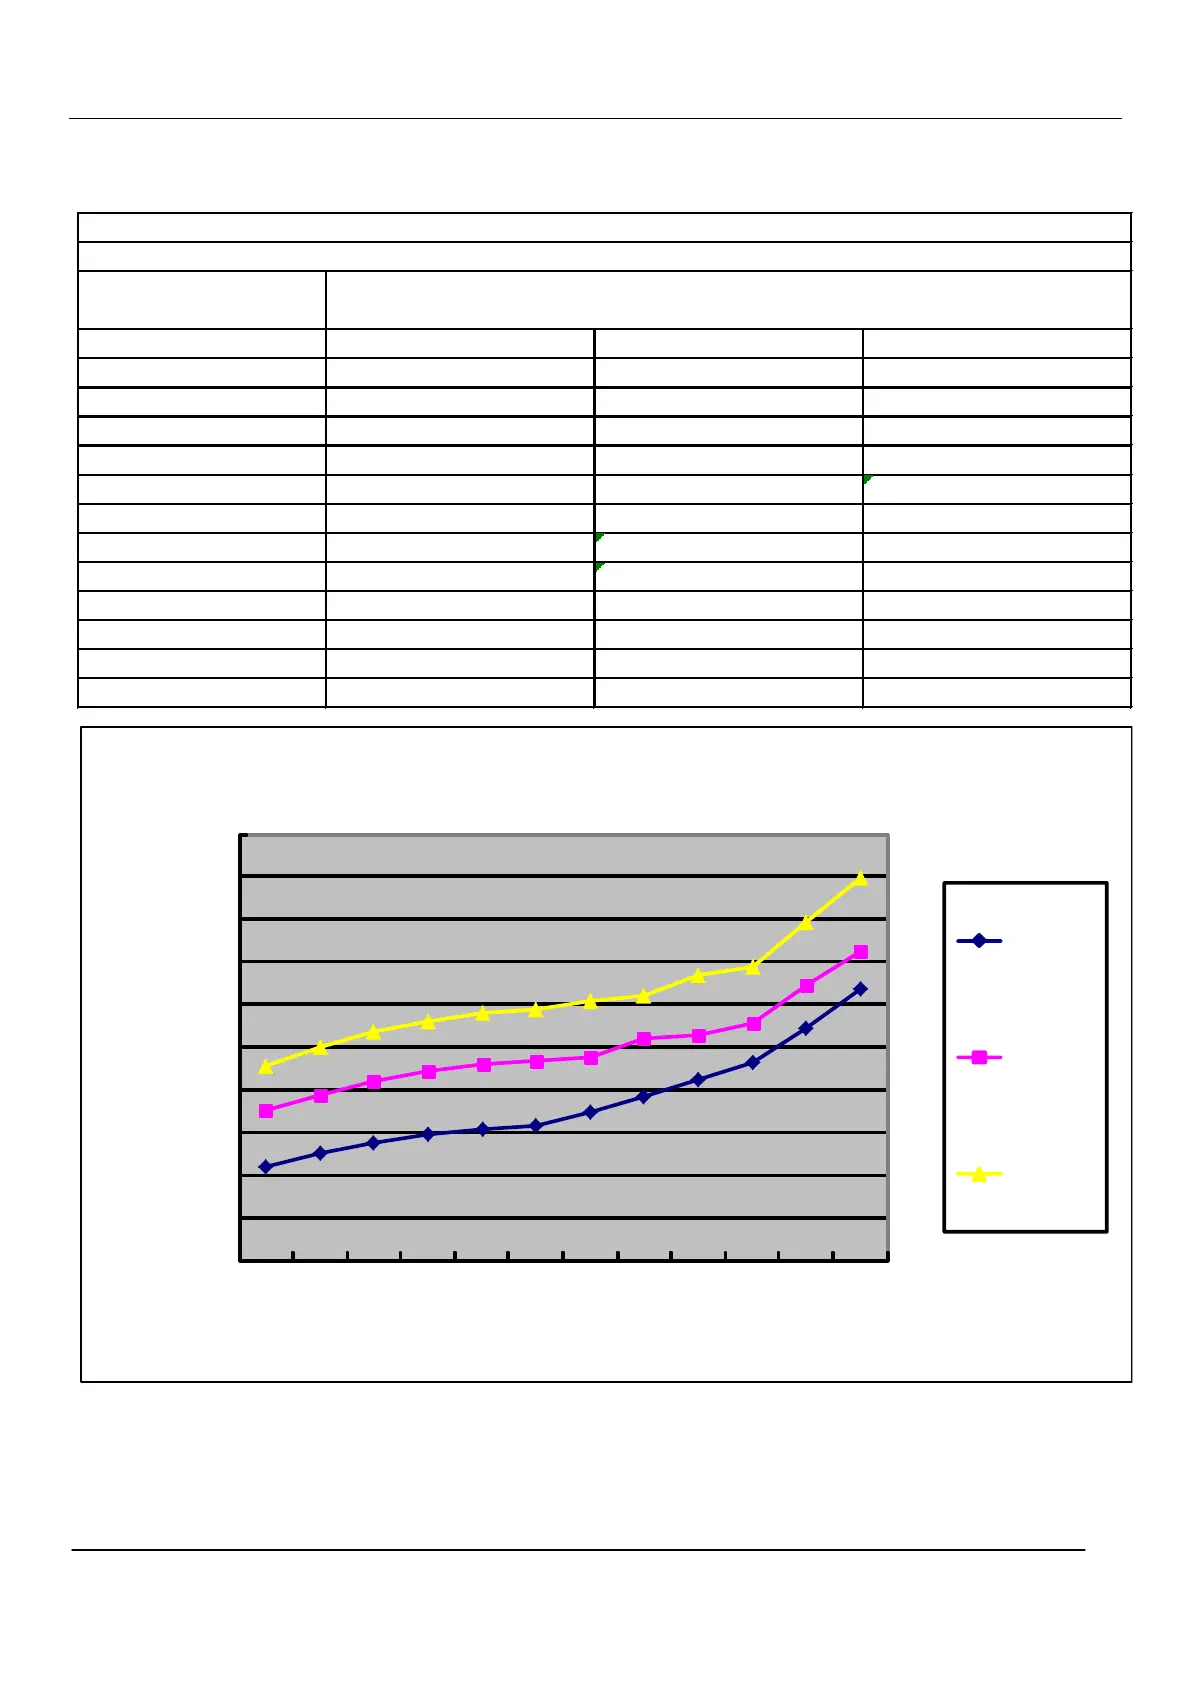
11.4 Cooling suction pressure curves
performance curves
cooling suction pressure.table
outdoor temp.
(humidity 46%)
indoor temp.
DB/WB 21/15℃ 27/19℃ 35/24℃
-20℃ 569 702 807
-10℃ 599 738 849
0℃ 624 769 885
8℃ 644 793 912
15℃ 657 809 931
20℃ 663 817 940
25℃ 698 826 959
30℃ 735 869 969
35℃ 774 878 1020
38℃ 815 905 1041
40℃ 896 996 1145
43℃ 986 1075 1248
cooling suction pressure and temp.curves
1350
1250
1150
21/15℃
1050
950
850
27/19℃
750
650
550
35/24℃
450
350
-20℃-10℃0℃ 8℃ 15℃20℃25℃30℃35℃38℃40℃43℃
outdoor temp.(DB/WB)
52 Domestic air conditioner
suction pressure (Kpa)
 Loading...