37
Subject to change without notice
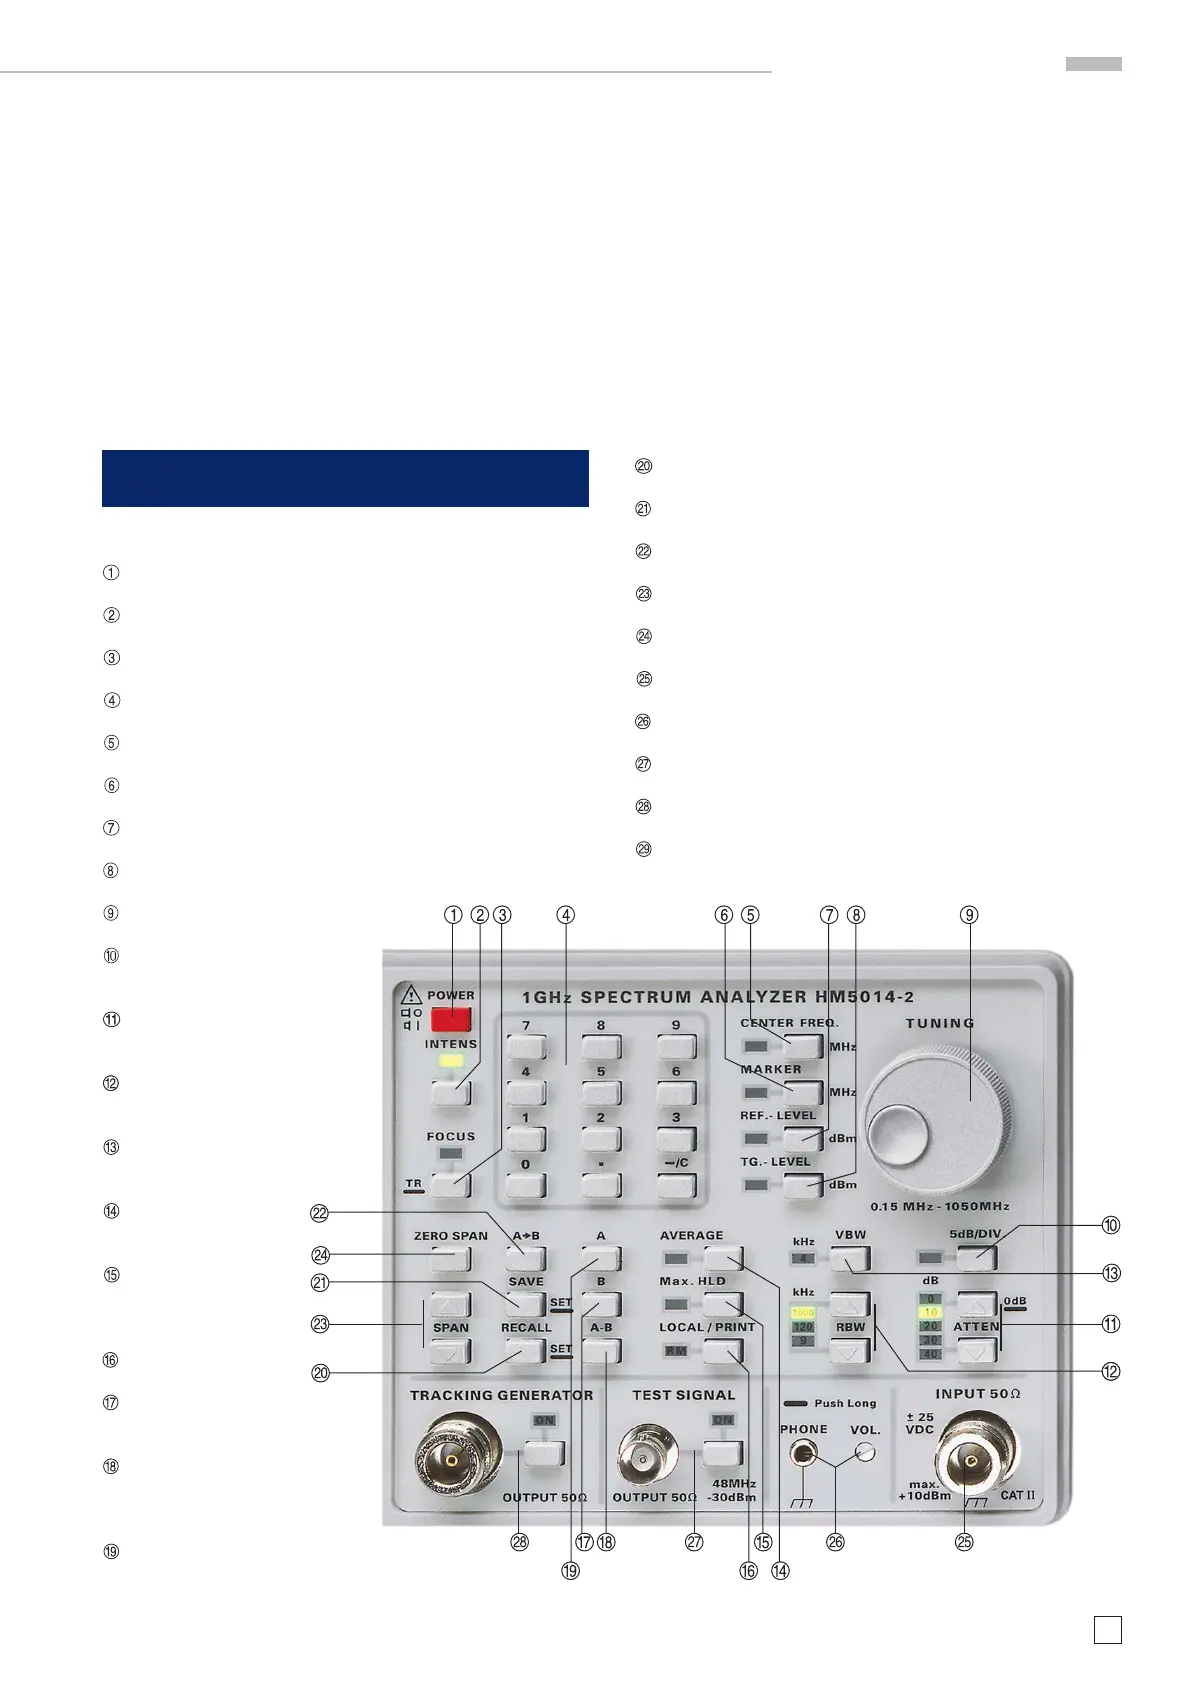
Control elements
displayed at the trace end position (right). The frequency of each
signal data (sample) can be calculated from center frequency
and span.
Frequency (x) = (Center Frequency – 0.5 * Span) + Span *
x/2000
X = 0… 2000 (Position of sample = sig_data[x])
Y-Position: The 8 bit value (hex: 00 bis FF) of each memory loca-
tion for sig_data[x] has the following relation to the screen:
1C hex (28 dec) coincides with the lowest horizontal graticule
line.
E5 hex (229 dec) coincides with the upmost (reference level)
Control elements
POWER (power switch)
INTENS (Intensity)
FOCUS / TR (Trace Rotation)
Keyboard
CENTER FREQ. (center frequency)
MARKER
REF.-LEVEL (reference level)
TG.-LEVEL (Tracking Generator level)
TUNING
5dB/DIV. (vertical
scaling)
ATTN. (input attenu-
ator)
RBW (resolution
bandwidth)
VBW (video band-
width)
AVERAGE (arithme-
tic mean value)
Max. HOLD (storing
of the maximum level
values automatically)
LOCAL/PRINT
B (display of memory
B)
A – B (displays the
difference of memo-
ry A and B)
A (display of memory
A)
RECALL/SET (calls the settings of the instrument)
SAVE/SET (saves the settings of the instrument)
A>B (copies signal from memory A to memory B)
SPAN (changes the measurement range values)
ZERO SPAN (measurement range at zero)
INPUT 50 Ohm
PHONE (headphone connector)
TEST SIGNAL
TRACKING GENERATOR
PROBE POWER
graticule line.
The a/d converter dependent resolution allows for 25 different
Y positions/div.
In combination with 10dB/div the resolution is 0.4 dB and in case
of 5dB/div it is 0.2dB.
The level (y) of a signal position can be calculated:
For y< 229 (Ref-Level position):
Level in dBm (y) = ref-level (dBm) – ((229-y) x 0.4 dB) at 10dB/
Div
For y > 229 ( Ref-Level position):
Level in dBm (y) = ref-level (dBm) + ((y-229) x 0.4 dB) at 10dB/
Div
 Loading...