3.4.3 Using Graphs
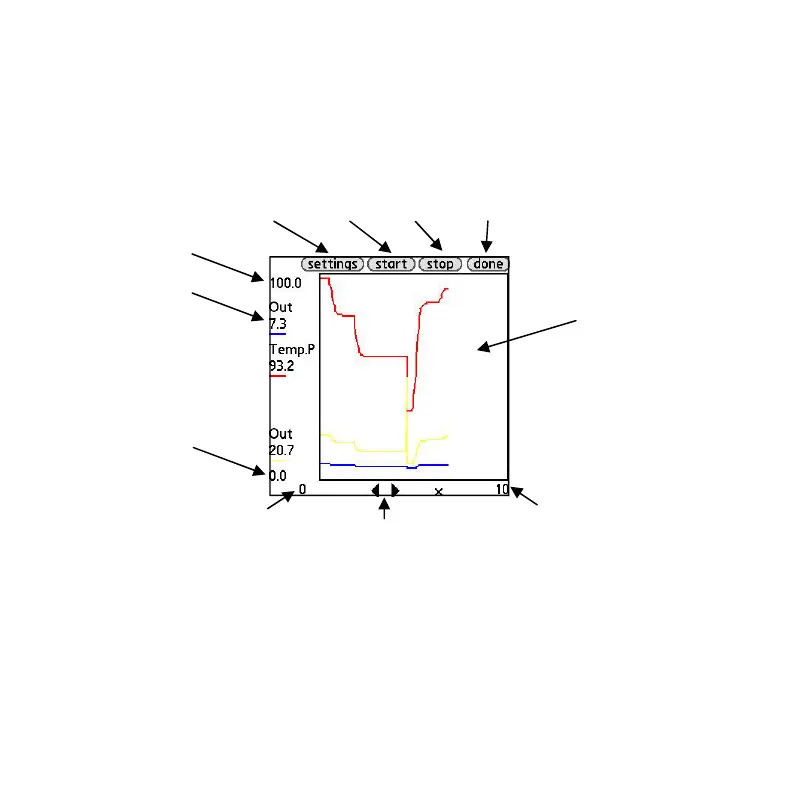
Once the graphing variables have been chosen and the “Graph” button has been selected, the
graphing will proceed. An example of the graphing screen can be seen in Figure 17 along with de-
scriptions of its various fields.
Variable List - Located on the left side column, the variable list provides information for each of the 4
graphed variables. The variable name, current value and line color is shown for each variable.
Graph Window - This is the area where the 4 variables will be graphed. Each color corresponds to
the appropriate variable in the Variable List.
Figure 17 - Graphing Screen
Variable List
Graphing
Window
Settings
Button
Start
Button
Stop
Button
Done
Button
Ymax
Ymin
Xmin
Xmax
X Axis Scroll Buttons