Do you have a question about the Hitachi ZA3000 Series and is the answer not in the manual?
Overview of the manual's structure and content.
Explains symbols and signal words used for warnings.
Verification of instrument connections and readiness.
Procedure for installing lamps into the turret.
Instructions for connecting and setting gas supply.
Steps to turn on the instrument and PC.
Procedure for activating the ventilation system.
Diagram illustrating the sequence of instrument operations.
Procedure for launching the main software application.
Configuring software to communicate with the instrument.
Basic interaction with software windows and elements.
Basic interaction with software windows and elements.
Mouse interaction techniques for software operation.
Description of UI components like menu, toolbar, toolbox.
Methods for entering analysis parameters into the software.
Procedure for loading existing method or data files.
Procedure for saving method or data files.
Accessing software help features.
Creating or modifying analysis parameter sets.
Validating the configured analysis parameters.
Observing real-time progress and data during measurement.
Optimizing the instrument's wavelength setting.
Ensuring correct alignment of the atomizer components.
Procedure for ensuring proper instrument cooling.
Steps to ignite the flame for analysis.
Initiating the actual sample measurement process.
Initiating the actual sample measurement process.
Customizing how measurement data is visualized.
Resetting the monitor graph display.
Customizing the appearance of profile graphs.
Customizing the appearance of working curve graphs.
Procedures for properly ending a measurement sequence.
Opening the primary interface for setting conditions.
Selecting the analysis mode (e.g., Flame, Graphite Furnace).
Choosing the elements to be analyzed.
Configuring instrument-specific parameters.
Defining specific parameters for analysis (e.g., fuel flow, burner height).
Inputting concentrations and details for standard samples.
Defining sample IDs, names, and other properties.
Configuring autosampler parameters for automated analysis.
Establishing parameters for quality control checks.
Configuring the output format for measurement results.
Reviewing all set measurement parameters.
Initiating the actual sample measurement process.
Customizing how measurement data is visualized.
Resetting the monitor graph display.
Customizing the appearance of profile graphs.
Customizing the appearance of working curve graphs.
Procedures for properly ending a measurement sequence.
Viewing and editing raw measurement data in tabular format.
Visualizing atomization signal profiles for analysis.
Displaying and analyzing calibration curves.
Storing and outputting measurement data and reports.
Performing post-measurement data manipulation.
Exporting data for use in external software.
Interpreting and addressing error indications in results.
Editing metadata associated with measurements.
Accessing parameters and formulas of the working curve.
Procedure for saving measurement results to a file.
Generating printed reports of measurement outcomes.
Configuring the layout for printing profile graphs.
Managing data entries by deleting or restoring.
Swapping sample data entries.
Selecting different methods for data calculation.
Adjusting factors for concentration calculations.
Editing sample identification names.
Modifying units for sample data.
Adjusting decimal precision for data.
Modifying names of used reagents.
Reverting data to a previous recalculated state.
Viewing detailed profile graph information.
Using a blank sample for background correction in analysis.
Exporting data to standard file formats.
Advanced data export and formatting for Excel.
Modifying Excel templates for custom reports.
Descriptions of measurement techniques beyond the standard working curve.
Utilizing stock solutions for preparing standards.
Procedure for adding matrix modifiers to samples.
Injecting multiple samples sequentially into the cuvette.
Using dual injection for improved measurement efficiency.
Procedures for cleaning the graphite cuvette.
Identifying and mitigating sample bumping during heating.
Adjusting working curves for sensitivity changes over time.
Enhancing low concentration signals by repeating injection/drying.
Performing sample dilution automatically via autosampler.
Using heated injection to improve sample dispersion.
Replicating previous measurement conditions for new samples.
Applying previously generated calibration curves.
Adding or re-measuring samples during a run.
Configuring the software to start automatically.
Activating energy-saving features.
Recovering measurement data after power interruption.
Measuring absorbance without generating a working curve.
Quantitative analysis using standard addition calibration.
A simplified standard addition technique.
Adding new samples to the sequence mid-run.
Re-running specific samples within a sequence.
Validating calibration curve quality using correlation.
Checking unknown sample concentration against calibration range and RSD.
Monitoring calibration sensitivity using standard samples.
Analyzing quality control samples to ensure accuracy.
Switching to the next element in a multi-element sequence.
Steps to properly stop an ongoing measurement sequence.
Shutting down the AAS software application.
Final steps to safely shut down the instrument.
List of necessary materials for instrument diagnosis.
Details of the performance parameters checked during diagnosis.
Step-by-step guide for performing instrument diagnosis.
Troubleshooting steps for when the flame fails to ignite.
Resolving issues where the start button is inactive.
Diagnosing and fixing low sensitivity issues.
Addressing inconsistent measurement results.
Troubleshooting issues with sample recovery rates.
Resolving problems with unstable baselines.
Addressing excessive signal noise.
Troubleshooting premature cuvette wear.
| Model | ZA3000 Series |
|---|---|
| Resolution | 0.1 nm |
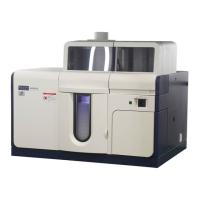
| Category | Spectrophotometer |
| Optical System | Double beam |
| Monochromator | Czerny-Turner mount |
| Spectral Bandwidth | 0.1, 0.2, 0.5, 1, 2 nm |
| Bandwidth | 0.1, 0.2, 0.5, 1.0, 2.0 nm (selectable) |
| Repeatability | ≤0.05 nm |
| Light Source | Deuterium lamp |
| Detector | Photomultiplier tube |
| Detector Type | Photomultiplier tube |
| Data Interval | 0.1 nm |
| Weight | 45 kg |
| Power Supply | AC 100 to 240 V, 50/60 Hz |
| Operating Temperature | 15 to 35 °C |
| Operating Humidity | 20-80% |
| Interface | USB |