2-20 Aplets and their views
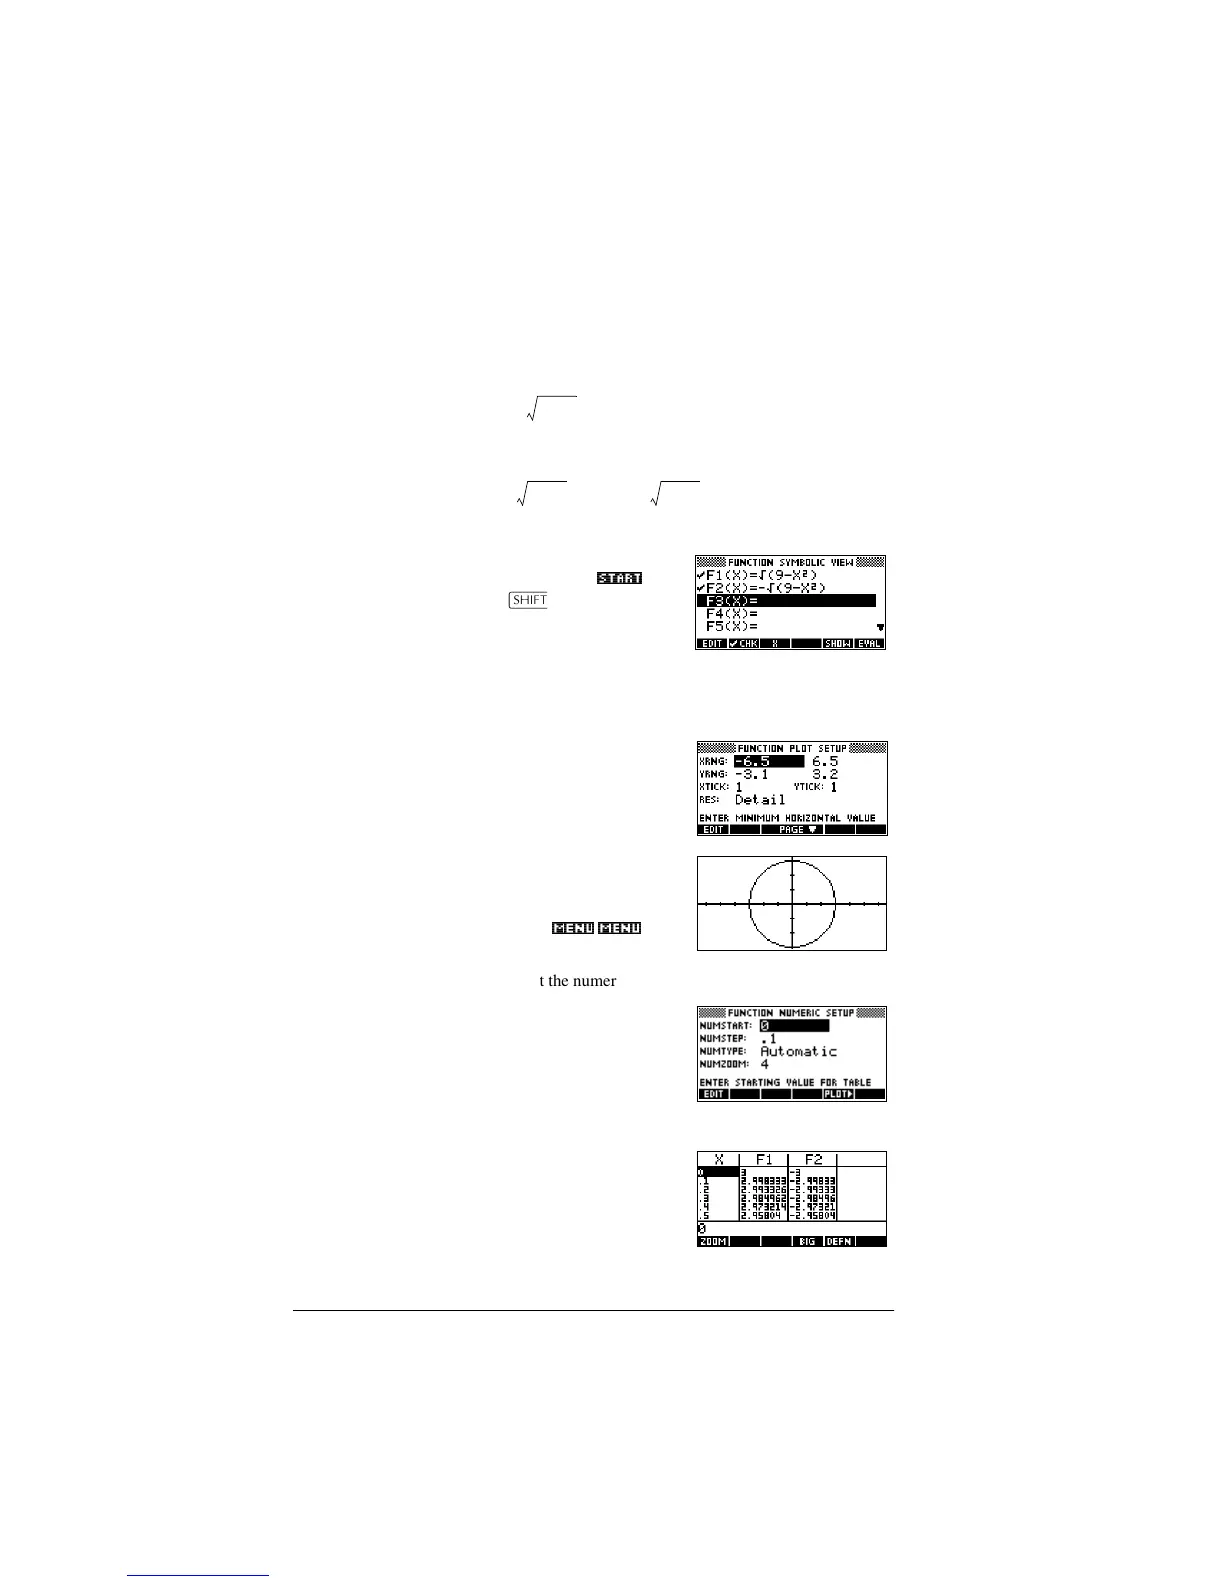
Example: plotting a circle
Plot the circle, x
2
+ y
2
= 9. First rearrange it to read
.
To plot both the positive and negative y values, you need to
define two equations as follows:
and
1. In the Function aplet, specify the functions.
>$3/(7@ Select
Function
67$57_
>6+,)7@√>@9
>@>;75@>;@>@>(17(5@
>@>6+,)7@√>@ 9
>@>;75@
>;@>@>(17(5@
2. Reset the graph setup to the default settings.
>6+,)7@
SETUP-PLOT
>6+,)7@CLEAR
3. Plot the two functions
and hide the menu so that
you can see all the circle.
>3/27@
0(18_0(18_
4. Reset the numeric setup to the default settings.
>6+,)7@
SETUP-NUM
>6+,)7@CLEAR
5. Display the functions in numeric form.
>180@