T
able 6-9.
Time Domain
Reection F
ormats
F
ormat
P
arameter
LIN
MAG
Reection
Coecient (unitless)
(0
<<
1)
REAL Reection
Coecient
(unitless)
(
0
1
<<
1)
LOG
MA
G
Return
Loss
(dB)
SWR Standing
W
ave
Ratio
(unitless)
Transmission
Measurements
Using
Bandpass
Mode
The
bandpass
mode
can
also
transform
transmission
measurements
to
the
time
domain.
F
or
example
, this
mode
can
provide
information
about
a
surface
acoustic
wave
(SA
W)
lter
that
is
not apparent
in
the
frequency
domain.
Figure
6-63
illustrates
a
time
domain
bandpass
measurement
of
a
321
MHz
SA
W
lter
.
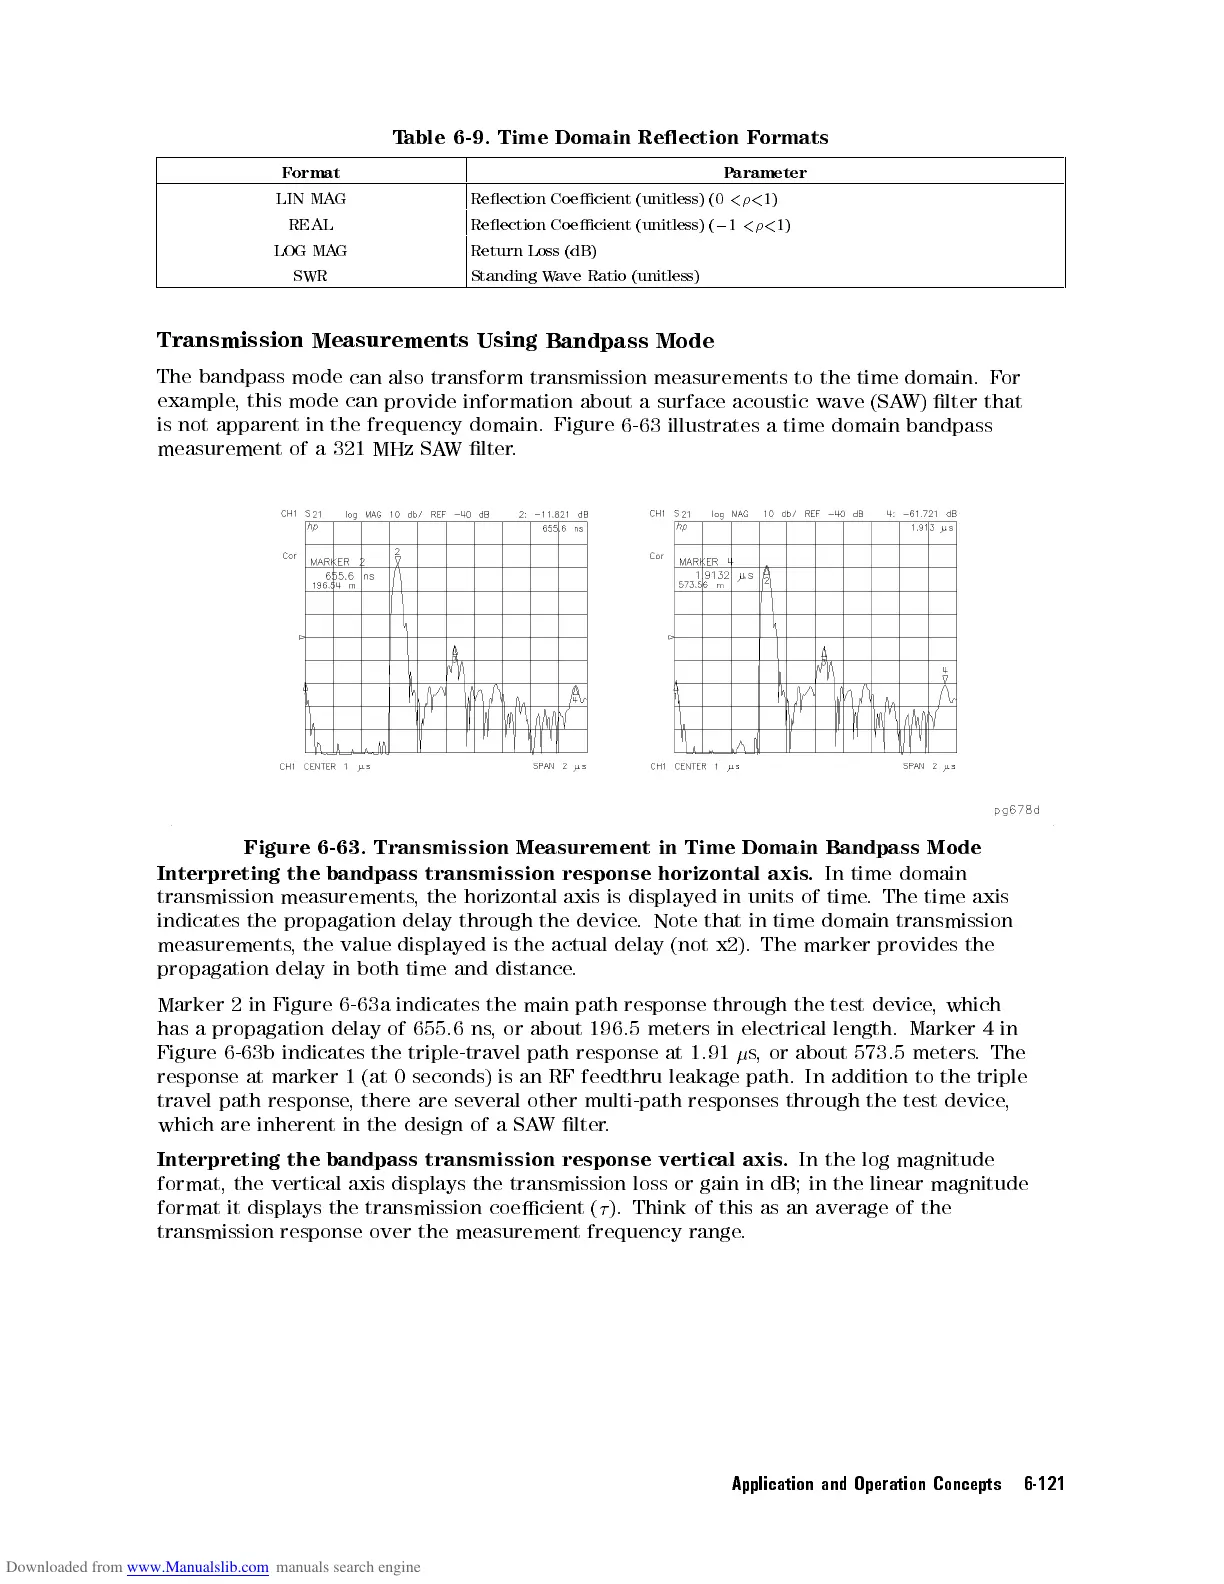
Figure
6-63.
Transmission
Measurement
in
Time
Domain Bandpass
Mode
Interpreting
the
bandpass
transmission
response
horizontal
axis
.
In
time
domain
transmission
measurements
,
the
horizontal
axis is
displayed in
units
of
time
.
The
time
axis
indicates
the
propagation
delay through
the device
. Note
that in
time
domain
transmission
measurements
,
the
value displayed
is the
actual delay
(not x2).
The
marker
provides
the
propagation
delay
in
both
time
and distance
.
Marker
2
in
Figure
6-63
a indicates
the main
path response
through the
test
device
,
which
has
a propagation
delay of
655.6
ns
,
or
about
196.5
meters
in
electrical
length.
Marker
4
in
Figure
6-63b
indicates the
triple-travel path
response at
1.91
s
,
or
about
573.5
meters
.
The
response
at
marker
1
(at
0
seconds)
is an
RF
feedthru
leakage
path.
In
addition
to
the
triple
travel path response
, there are several other multi-path responses
through the test device
,
which are inherent in the design of a SA
W
lter.
Interpreting the bandpass transmission response vertical axis
.
In the log magnitude
format, the vertical axis displays the transmission loss or gain in dB; in the linear magnitude
format it displays the transmission coecient (
). Think of this as an average of the
transmission response over the measurement frequency range
.
Application and Operation Concepts 6-121