E-24
R(t) The cumulative fraction of the standard normal
distribution that lies between t and 0. R(t) = 1 – t.
Q(t) The cumulative fraction of the standard normal
distribution that is greater than t. Q(t) = | 0.5– t |.
Regression Calculation
There are six regression options on the REG menu:
LIN Linear Regression y = a + b x
LOG Logarithmic Regression y = a + b lnx
e ^ Exponential Regression y = a • e
bx
PWR Power Regression y = a • x
b
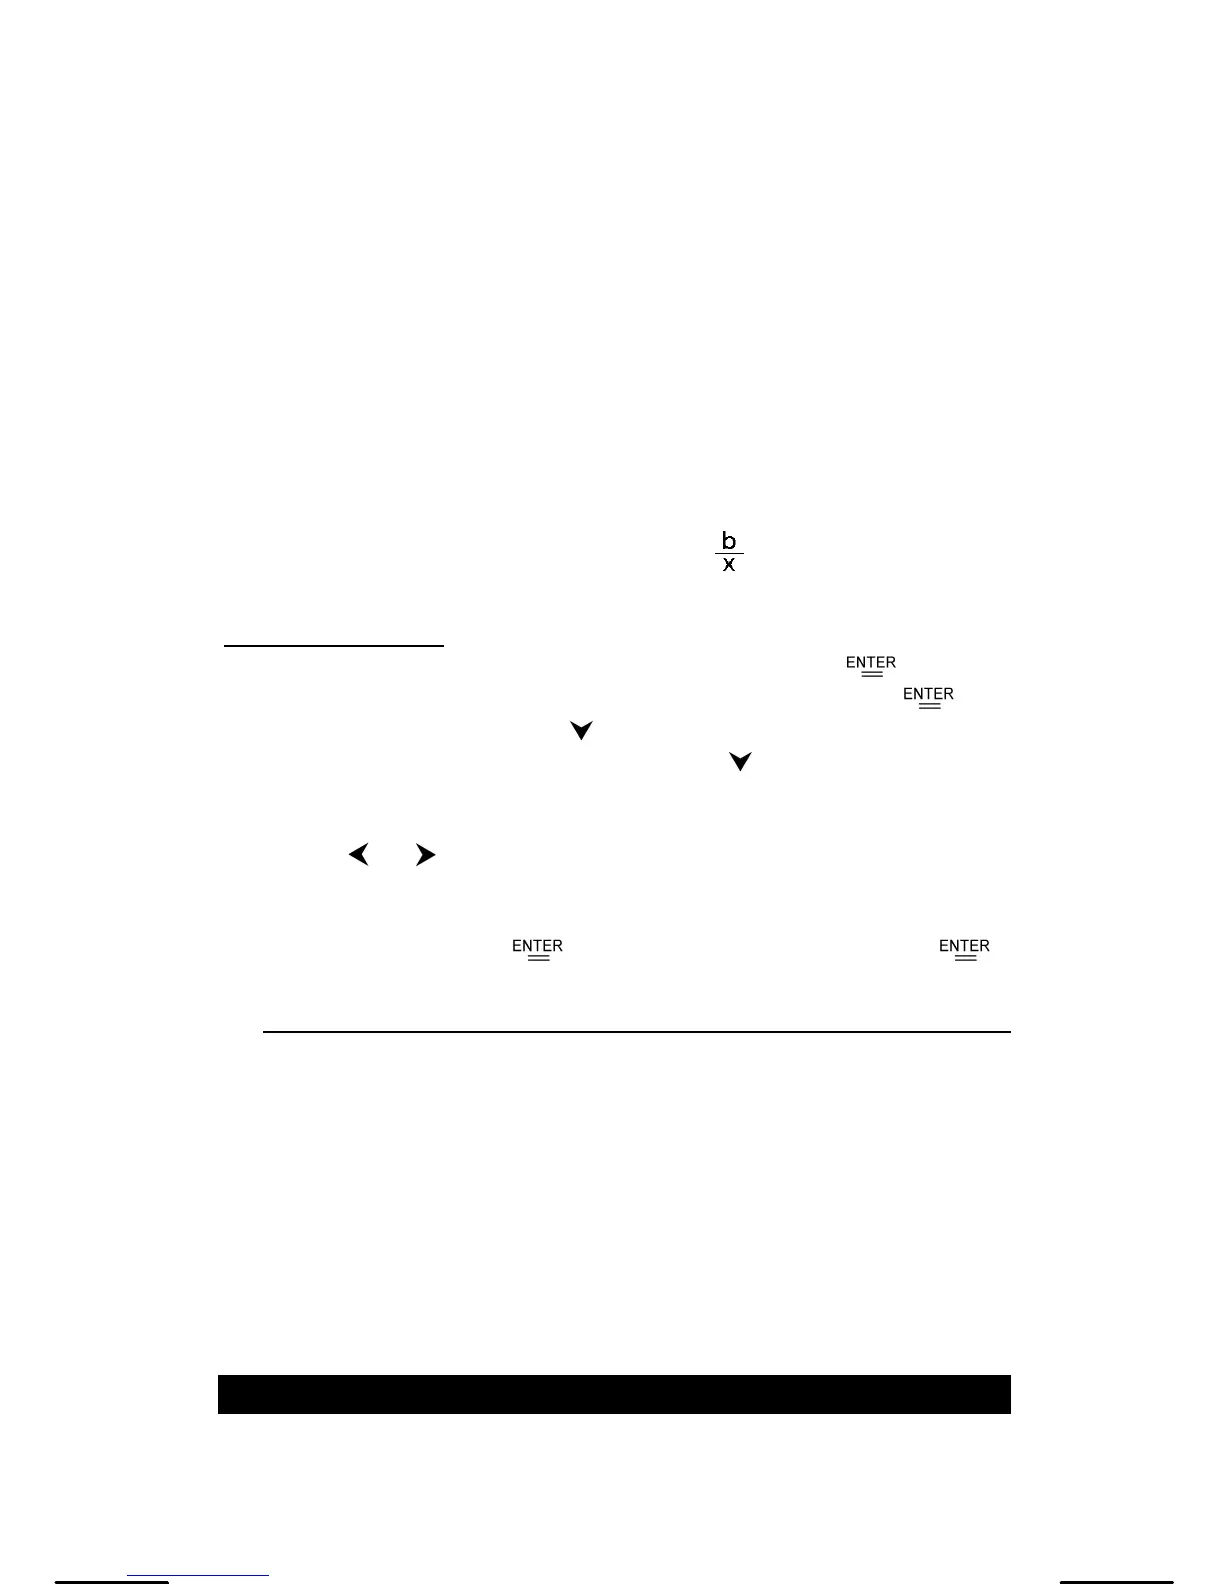
INV Inverse Regression y = a +
QUAD Quadratic Regression y = a + b x + c x
2
See Example 47~48.
1. Select a regression option on the REG menu and press [ ] .
2. Press [ DATA ], select DATA-INPUT from the menu and press [ ].
3. Enter an x value and press [
].
4. Enter the corresponding y value and press [
].
5. To enter more data, repeat from step 3.
6. Press [ 2nd ] [ STATVAR ].
7. Press [ ] [
] to scroll through the results until you find the
regression variables you are interested in (see table below).
8. To predict a value for x (or y) given a value for y (or x), select the x ’
(or y ’) variable, press [ ] , enter the given value, and press [ ]
again.
Variable Meaning
a Y-intercept of the regression equation.
b Slope of the regression equation.
r Correlation coefficient.
c Quadratic regression coefficient.
x ’ Predicted x value given a, b, and y values.
y ’ Predicted y value given a, b, and x values.
9. To draw the regression graph, press [ Graph ] on the STATVAR menu.
To return to the STATVAR menu, press [ 2nd ] [ STATVAR ].
Chapter 7 : BaseN Calculations
 Loading...