Configuration and Calibration Guide HD0679 Rev 1.2.0 29
Chapter 3 Sensor Integration and Material Calibration
1 Sensor Integration
The sensor may be integrated into a process in one of three ways:-
• The sensor may be configured to output a linear value of between 0-100 Unscaled units
with a material calibration being performed in an external control system.
Or
• The sensor may be internally calibrated using the Hydro-Com sensor configuration and
calibration software to output an absolute moisture percentage value.
Or
• The sensor could also be used to output a target value
Software development tools are available from Hydronix for system designers who wish to
develop their own interface.
For full details about how to integrate the sensor into a control system or process see
document EN0077 ‘Moisture control methods for batching’.
2 Introduction to Material Calibration
2.1 The “Unscaled” Value
When it is manufactured, each sensor is individually calibrated in a controlled environment so
that a zero (0) value relates to the measurement in air and 100 relates to water. This is used
to give a raw output value from a Hydronix sensor which ranges from 0 to 100 and is called
the Unscaled value.
2.2 Why Calibrate?
Hydronix Microwave Moisture Sensors measure the electrical properties of a material. Each
material has its own unique electrical characteristics and as a result a calibration process
must be performed to output a true moisture/Brix value. As the moisture in a material varies
the sensor detects the changes and the Unscaled value is adjusted accordingly. Due to every
material having a different electrical property the Unscaled value at a certain moisture % will
result in a different Unscaled value for each material.
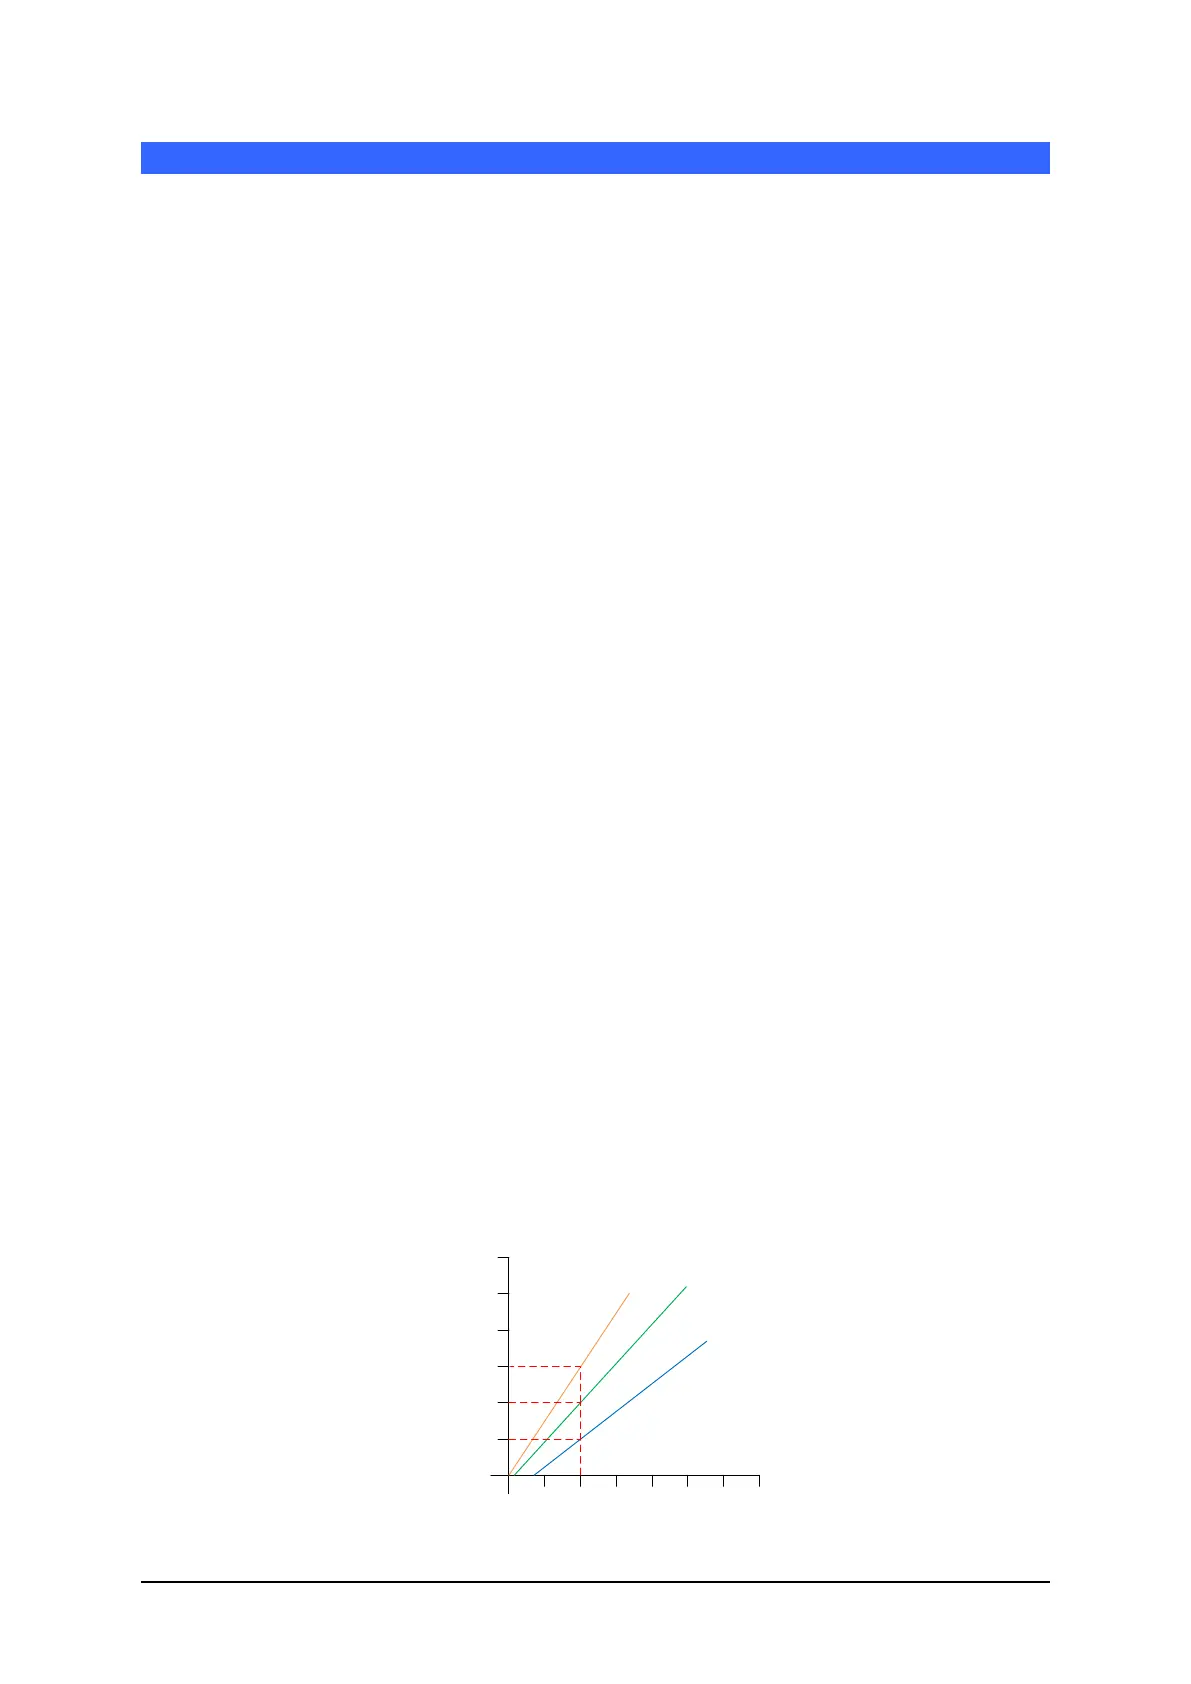
Figure 14: Calibrations for 3 Different Materials shows the calibration line for three different
materials. It can be seen that for each material when the Unscaled value is at 20 the
corresponding Moisture % is different. For material A an Unscaled value of 20 corresponds to
a moisture of 15%. At the same Unscaled value for Material B the moisture is 10%.
Sensor Unscaled
Moisture %
10 20 30 40
50
60 70
30
25
20
15
10
5
Material A
Material B
Material C
Figure 14: Calibrations for 3 Different Materials