Sensor Integration and Material Calibration Chapter 3
Configuration and Calibration Guide HD0679 Rev 1.2.0 39
5. The average of the laboratory results and the Filtered Unscaled value make up one
calibration point.
6. Steps 3-5 should be repeated for additional calibration points. Ideally calibration points
should be collected to cover the entire expected Brix range of the material.
Hydro-Com software should be used to calculate the calibration coefficients and to update the
sensor with the calibration.
9.1 Good/Bad Brix Calibration
A good Brix calibration is achieved by analysing the material over the working range. A good
spread of points is necessary to provide higher accuracy.
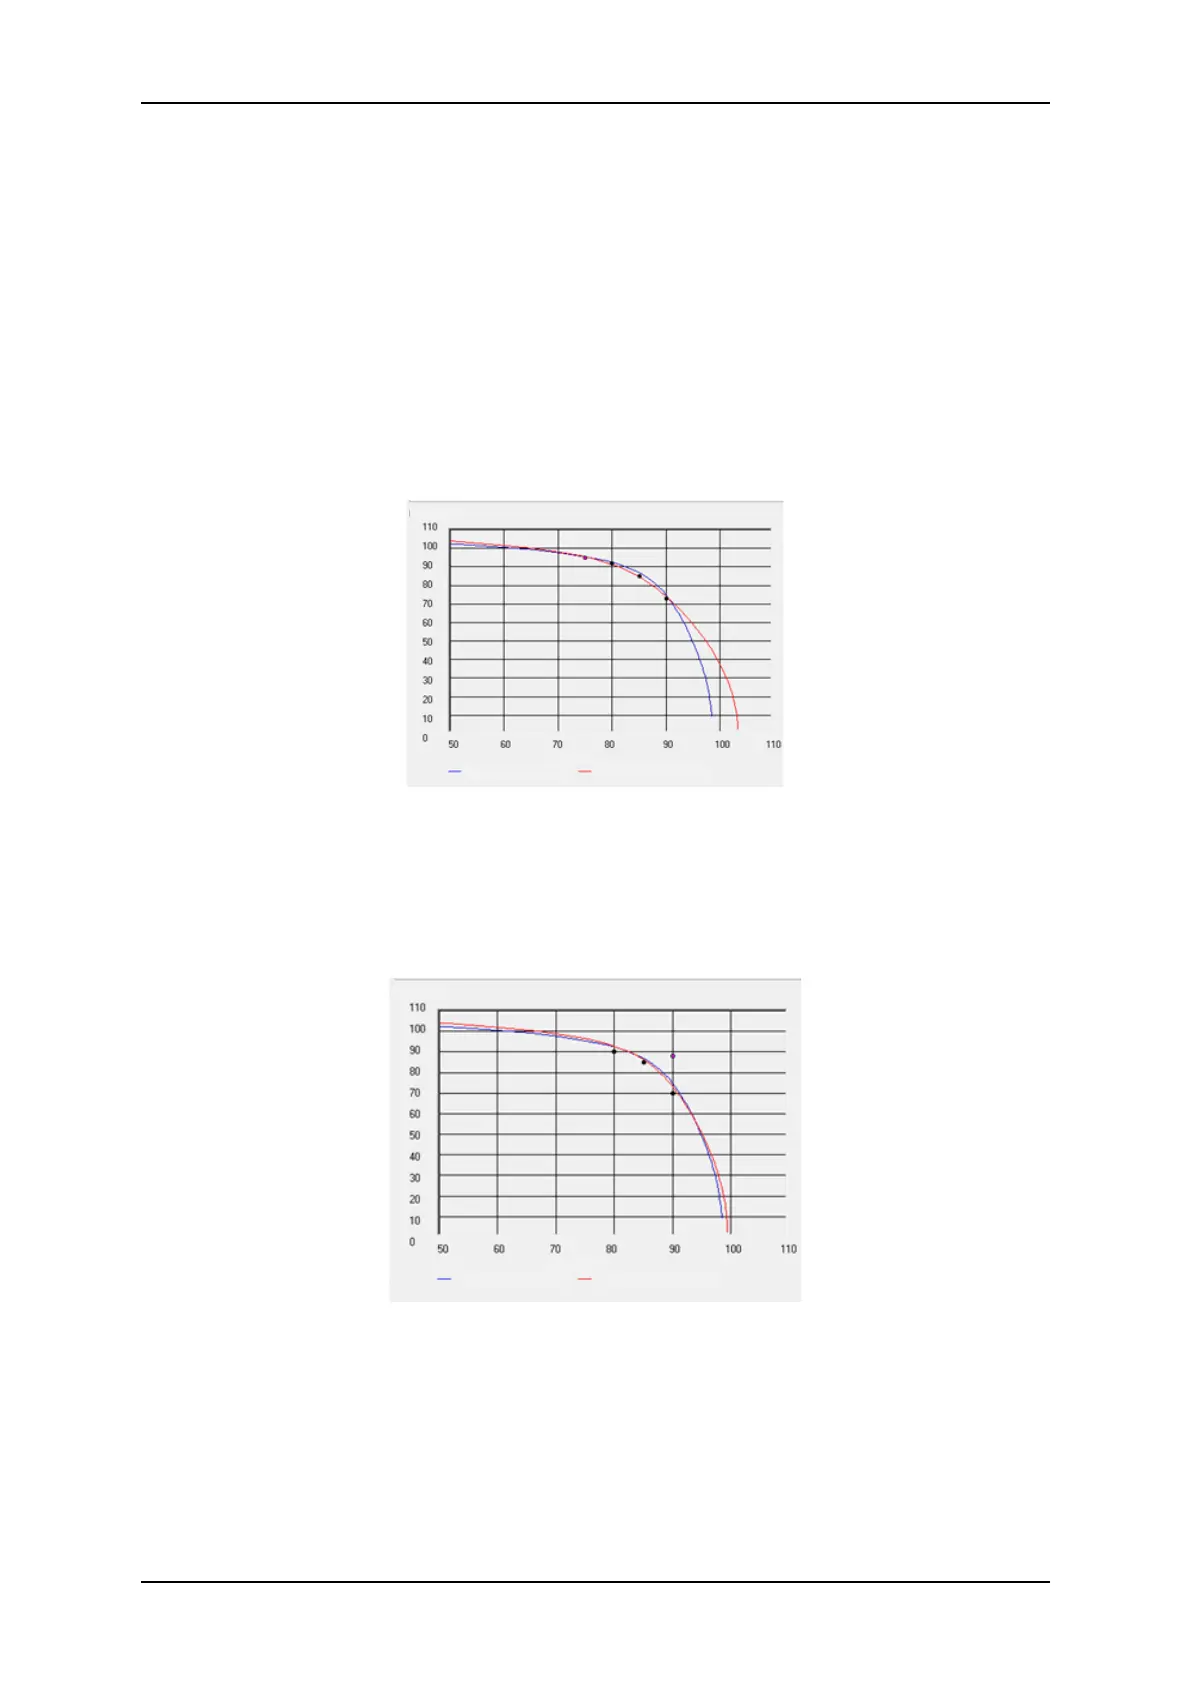
Figure 22 shows a good calibration with all points close to the best fit curve.
Improved Calibration
Current Calibration
Brix
Unscaled
Figure 22: Example of a Good Brix Calibration
Figure 23 is an example of a bad Brix calibration, this is evident as the points are not all close
to the best fit curve.
Unscaled
Brix
Improved Calibration
Current Calibration
Figure 23: Example of a Bad Brix Calibration
For full details on the use of Hydro-Com see user guide HD0682.