Graph Area
The magnitude tab shows the imported driver responses, filters, individual biquads, individual fil-
tered driver responses and the sum.
Colour Function
Blue, thin Measured woofer response
Green, thin Measured midrange response
Red. thin Measured tweeter response
Blue, thick Filtered woofer response
Green, thick Filtered midrange response
Red, thick Filtered tweeter response
Light blue, thick Response of filter, selected channel only
Orange, thick Response of selected biquad
Black, thick Sum response
Having all of these on at the same time quickly produces an intractable mess so these graphs can be
separately enabled or disabled in the filter definition area.
The impulse or step tabs show the time domain response of the imported drivers and the sum re-
sponse, and are used to demarcate the anechoic portion.
Filter Definition Area
The two channel tabs, labelled Tweeter and Woofer are functionally identical. The top left frame is
used to import response files. The “select” button opens a file. The “show” checkbox turns display of
the measured graph on or off. The Common Settings box controls global gain (for each channel),
delay, and the visibility of plots.
The amplified channels have up to 12 biquads, selected using the “Biquad Section” radio buttons in
the middle. To the right is a settings area specific to the type of function selected. Unused biquads
are set to unity.
The selected biquad is edited by selecting a function and setting relevant parameters.
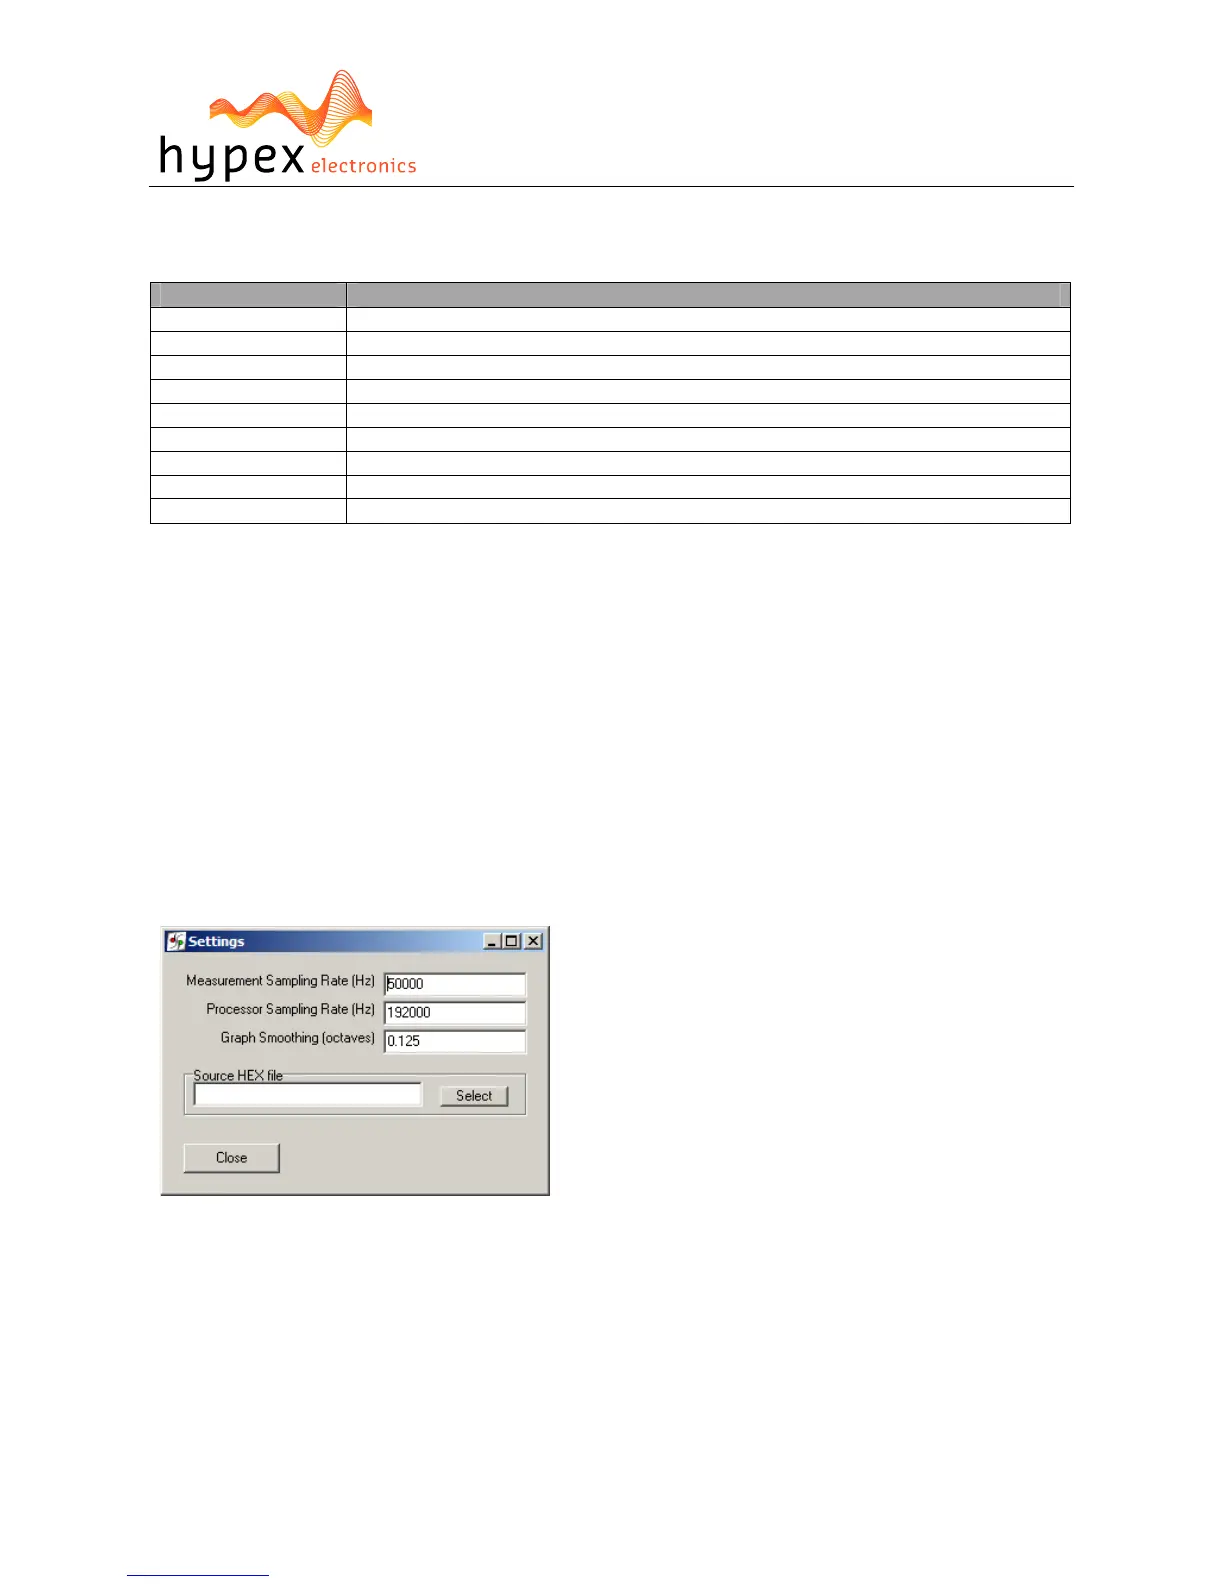
Settings Window
Figure 10
The settings window is under File > Settings… Measurement sampling rate sets the sample rate used
in the imported response files (typically 48kHz). Processor sampling rate is that of the Hypex DSP
hardware. Note that this setting does not control the sampling rate of the hardware. Rather, it in-
forms the filter design application of what that sampling rate is. In short, leave this at 46,875kHz.
The select button opens a file dialogue box witch is not used in this application.
Work flow
Measurement
Measuring using the DSP unit set to “flat”