Kappa Series Powered Subwoofer – Owner’s Manual
◆
17
Read the following instructions fully before beginning tests.
For the following steps, you will need a Measurement Template and a pencil.
Performing
Low-Frequency
Measurements
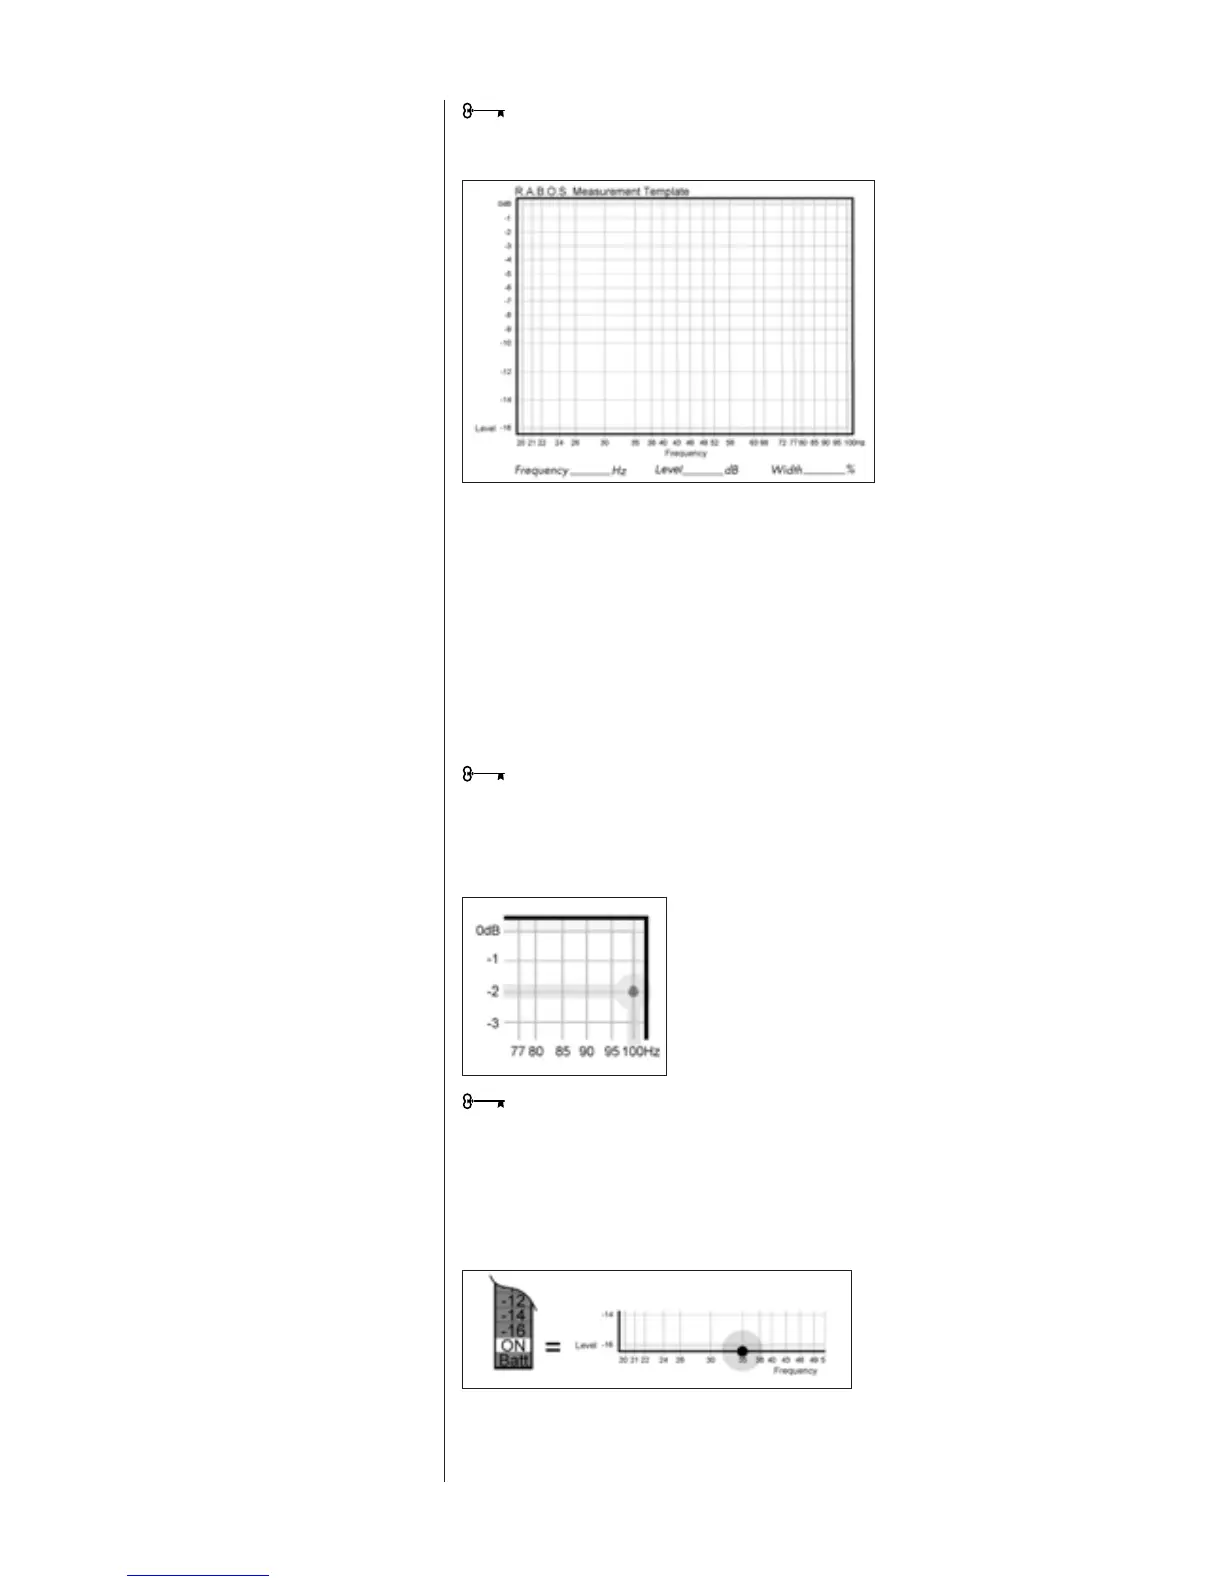
Figure 8
R.A.B.O.S. Measurement Template
Each of the following tracks produces a low-frequency test tone. The range of these
tests is from 100Hz down to 20Hz. The frequency of each test is announced before it
begins. The first test is the highest frequency (100Hz); therefore, you will be marking
the template from right to left. Each frequency point is listed across the bottom of the
Measurement Template (this is called the X-axis). See Figure 8. The vertical scale on
the left side of the template indicates relative level, in dBs (the Y-axis). The template’s
vertical scale matches that of the RSLM bar graph.
Cue Track 4 and Pause II.
From now on, you will want to keep your CD player’s remote control handy.
Press Play
G
. As Track 4 plays, observe the level indicated on the RSLM.
EXAMPLE: The test frequency is 100 Hz and the level indicated is -2 dB. Find the
intersection of 100 Hz (X-axis) and -2 dB (Y-axis). Place a dot at that point. See Figure 9.
It takes a few seconds for the RSLM reading to stabilize, especially at very low
frequencies. Don’t rush. Give each test adequate time for the meter to stabilize.
At the bottom of the bar graph is a green “ON” LED. This LED is illuminated whenever
the sound level is below the measuring range of the RSLM. If this occurs during a test,
place a dot at the intersection of the test frequency and the bottom frame of the
template. See Figure 10.